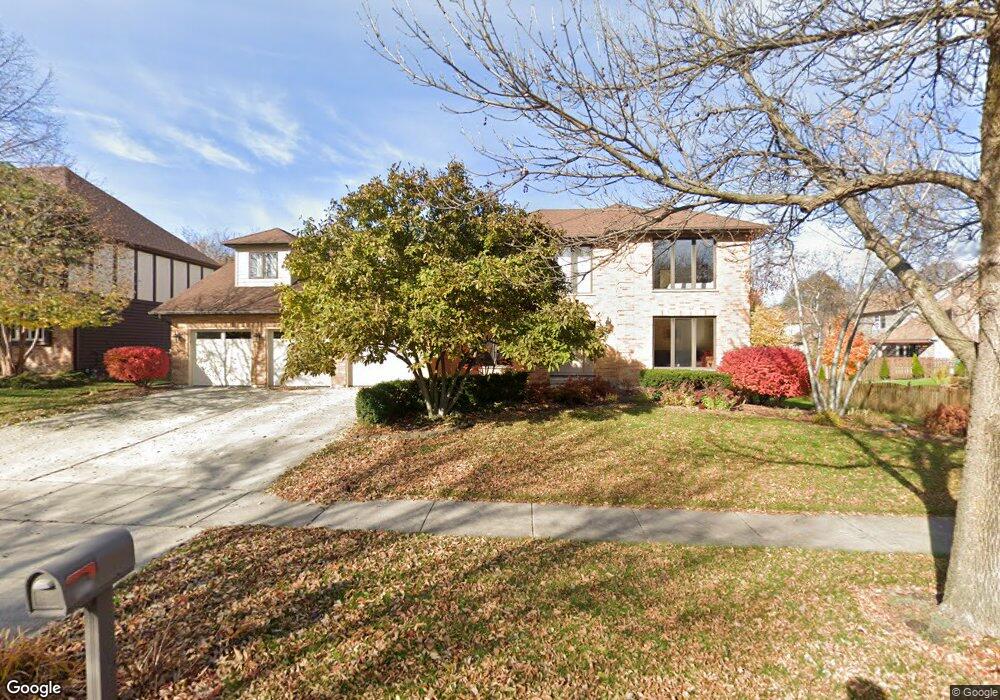
405 Sagebrush Rd Naperville, IL 60565
Winding Creek Estates NeighborhoodEstimated Value: $847,000 - $930,000
5
Beds
3
Baths
3,500
Sq Ft
$253/Sq Ft
Est. Value
About This Home
This home is located at 405 Sagebrush Rd, Naperville, IL 60565 and is currently estimated at $884,291, approximately $252 per square foot. 405 Sagebrush Rd is a home located in DuPage County with nearby schools including Maplebrook Elementary School, Lincoln Jr. High School, and Naperville Central High School.
Ownership History
Date
Name
Owned For
Owner Type
Purchase Details
Closed on
Sep 20, 2024
Sold by
Llewellyn Michael and Llewellyn Kelly A
Bought by
Kelly A Llewellyn Trust and Llewellyn
Current Estimated Value
Purchase Details
Closed on
Dec 15, 2020
Sold by
Gentile Jacqueline E and Jacqueline S Gentile Trust
Bought by
Llewellyn Michael and Llewellyn Kelly A
Home Financials for this Owner
Home Financials are based on the most recent Mortgage that was taken out on this home.
Original Mortgage
$387,000
Interest Rate
2.87%
Mortgage Type
New Conventional
Purchase Details
Closed on
Aug 5, 2019
Sold by
Gentile Jacqueline S and Gentile Jacqueline L
Bought by
Gentile Jacqueline S and Jacqueline S Gentile Trust
Purchase Details
Closed on
Dec 16, 1999
Sold by
Gentile James F
Bought by
Gentile Jacqueline L
Create a Home Valuation Report for This Property
The Home Valuation Report is an in-depth analysis detailing your home's value as well as a comparison with similar homes in the area
Home Values in the Area
Average Home Value in this Area
Purchase History
| Date | Buyer | Sale Price | Title Company |
|---|---|---|---|
| Kelly A Llewellyn Trust | -- | None Listed On Document | |
| Llewellyn Michael | $570,000 | First American Title | |
| Gentile Jacqueline S | -- | Attorney | |
| Gentile Jacqueline L | -- | -- |
Source: Public Records
Mortgage History
| Date | Status | Borrower | Loan Amount |
|---|---|---|---|
| Previous Owner | Llewellyn Michael | $387,000 |
Source: Public Records
Tax History
| Year | Tax Paid | Tax Assessment Tax Assessment Total Assessment is a certain percentage of the fair market value that is determined by local assessors to be the total taxable value of land and additions on the property. | Land | Improvement |
|---|---|---|---|---|
| 2024 | $13,737 | $232,245 | $78,584 | $153,661 |
| 2023 | $13,253 | $211,960 | $71,720 | $140,240 |
| 2022 | $12,145 | $193,660 | $65,530 | $128,130 |
| 2021 | $11,705 | $186,330 | $63,050 | $123,280 |
| 2020 | $11,134 | $182,980 | $61,920 | $121,060 |
| 2019 | $10,799 | $175,060 | $59,240 | $115,820 |
| 2018 | $10,802 | $175,060 | $59,240 | $115,820 |
| 2017 | $10,910 | $169,150 | $57,240 | $111,910 |
| 2016 | $10,696 | $163,030 | $55,170 | $107,860 |
| 2015 | $10,634 | $153,520 | $51,950 | $101,570 |
| 2014 | $10,756 | $150,510 | $50,930 | $99,580 |
| 2013 | $10,594 | $150,870 | $51,050 | $99,820 |
Source: Public Records
Map
Nearby Homes
- 303 Cedarbrook Rd
- 48 Starling Ln
- 2050 Lancaster Cir Unit 201D
- 47 Glencoe Ct Unit 102D
- 97 Midhurst Ct Unit 202
- 95 Midhurst Ct Unit 101
- 2221 Woodland Cir
- 23 Glencoe Ct Unit 202B
- 96 Midhurst Ct Unit 201
- 1751 S Washington St Unit 1
- 1754 S Washington St Unit 1754
- 40 Harbor Ct Unit 304
- 309 Carriage Hill Rd
- 138 E Bailey Rd Unit M
- 128 E Bailey Rd Unit G
- 124 E Bailey Rd Unit E
- 18 Newgate Ave
- 2308 Modaff Rd
- 1712 Coach Dr
- 425 Carriage Hill Rd
- 409 Sagebrush Rd
- 1519 Terrance Dr Unit 4
- 406 Sagebrush Rd
- 1534 Welton Ct
- 1517 Terrance Dr
- 400 Sagebrush Rd Unit 4
- 413 Sagebrush Rd
- 410 Sagebrush Rd Unit 5
- 1535 Welton Ct
- 1515 Terrance Dr
- 414 Sagebrush Rd
- 417 Sagebrush Rd
- 1513 Terrance Dr
- 1520 Terrance Dr
- 1524 Terrance Dr
- 1522 Terrance Dr
- 1527 Terrance Dr
- 1531 Welton Ct
- 418 Sagebrush Rd
- 1518 Terrance Dr