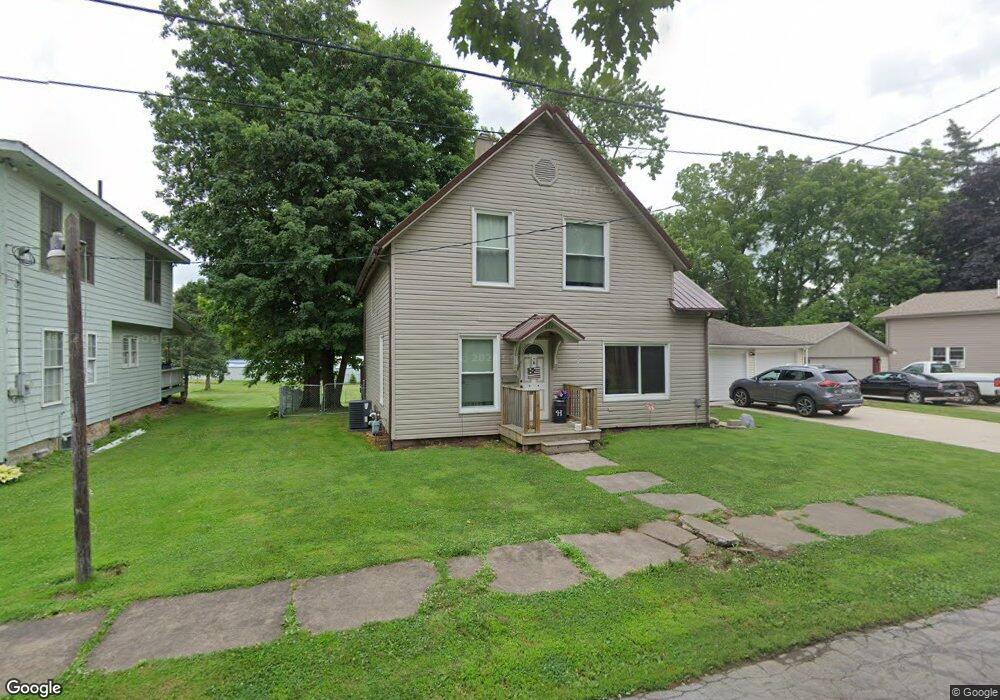
405 Wabash Ave La Porte, IN 46350
Estimated Value: $105,000 - $228,000
3
Beds
1
Bath
1,935
Sq Ft
$88/Sq Ft
Est. Value
About This Home
This home is located at 405 Wabash Ave, La Porte, IN 46350 and is currently estimated at $169,489, approximately $87 per square foot. 405 Wabash Ave is a home located in LaPorte County with nearby schools including La Porte High School, Riley Elementary School, and Dunkerton High School.
Ownership History
Date
Name
Owned For
Owner Type
Purchase Details
Closed on
Jul 30, 2019
Sold by
Hurley Brian M
Bought by
Hurley Brian M and Hurley Delenna K
Current Estimated Value
Purchase Details
Closed on
Oct 1, 2012
Sold by
Jones Deborah S
Bought by
Hurley Brian M
Purchase Details
Closed on
Oct 16, 2009
Sold by
Secretary Of Housing & Urban Development
Bought by
Jones Deborah S
Home Financials for this Owner
Home Financials are based on the most recent Mortgage that was taken out on this home.
Original Mortgage
$26,400
Interest Rate
5.07%
Mortgage Type
New Conventional
Purchase Details
Closed on
Jun 4, 2009
Sold by
Wells Fargo Bank Na
Bought by
The Secretary Of Housing & Urban Develop
Purchase Details
Closed on
Apr 2, 2009
Sold by
Clark Brad L
Bought by
Wells Fargo Bank Na
Create a Home Valuation Report for This Property
The Home Valuation Report is an in-depth analysis detailing your home's value as well as a comparison with similar homes in the area
Home Values in the Area
Average Home Value in this Area
Purchase History
| Date | Buyer | Sale Price | Title Company |
|---|---|---|---|
| Hurley Brian M | -- | None Available | |
| Hurley Brian M | -- | None Available | |
| Jones Deborah S | -- | None Available | |
| The Secretary Of Housing & Urban Develop | -- | None Available | |
| Wells Fargo Bank Na | $94,832 | None Available |
Source: Public Records
Mortgage History
| Date | Status | Borrower | Loan Amount |
|---|---|---|---|
| Previous Owner | Jones Deborah S | $26,400 |
Source: Public Records
Tax History Compared to Growth
Tax History
| Year | Tax Paid | Tax Assessment Tax Assessment Total Assessment is a certain percentage of the fair market value that is determined by local assessors to be the total taxable value of land and additions on the property. | Land | Improvement |
|---|---|---|---|---|
| 2024 | $662 | $72,100 | $22,100 | $50,000 |
| 2023 | $583 | $67,400 | $19,000 | $48,400 |
| 2022 | $535 | $69,000 | $19,000 | $50,000 |
| 2021 | $511 | $65,400 | $19,000 | $46,400 |
| 2020 | $926 | $65,400 | $19,000 | $46,400 |
| 2019 | $974 | $92,600 | $20,800 | $71,800 |
| 2018 | $886 | $83,800 | $14,900 | $68,900 |
| 2017 | $821 | $79,400 | $13,400 | $66,000 |
| 2016 | $629 | $65,300 | $9,100 | $56,200 |
| 2014 | $596 | $66,200 | $9,100 | $57,100 |
Source: Public Records
Map
Nearby Homes