4053 Kinneys Rd Cedar Hill, TN 37032
Estimated Value: $380,360 - $463,000
--
Bed
2
Baths
2,211
Sq Ft
$188/Sq Ft
Est. Value
About This Home
This home is located at 4053 Kinneys Rd, Cedar Hill, TN 37032 and is currently estimated at $415,590, approximately $187 per square foot. 4053 Kinneys Rd is a home located in Robertson County with nearby schools including Westside Elementary School, Cheatham Park Elementary School, and Jo Byrns High School.
Ownership History
Date
Name
Owned For
Owner Type
Purchase Details
Closed on
Jul 20, 2021
Sold by
Laborg Mike P and Mason William C
Bought by
Leard Shananni Lynn
Current Estimated Value
Home Financials for this Owner
Home Financials are based on the most recent Mortgage that was taken out on this home.
Original Mortgage
$340,000
Outstanding Balance
$308,639
Interest Rate
2.93%
Mortgage Type
New Conventional
Estimated Equity
$106,951
Purchase Details
Closed on
Oct 27, 2020
Sold by
Dillard Mark Edwin and Dillard Jackie C
Bought by
Laborg Mike P and Mason William C
Purchase Details
Closed on
Sep 10, 2003
Sold by
Carlos Dillard
Bought by
Edwin Dillard Mark
Purchase Details
Closed on
Dec 19, 2000
Sold by
Ernestine Goodwin
Bought by
Dillard Mark E
Purchase Details
Closed on
Jul 19, 1971
Bought by
Goodwin Ernestine
Create a Home Valuation Report for This Property
The Home Valuation Report is an in-depth analysis detailing your home's value as well as a comparison with similar homes in the area
Home Values in the Area
Average Home Value in this Area
Purchase History
| Date | Buyer | Sale Price | Title Company |
|---|---|---|---|
| Leard Shananni Lynn | $340,000 | Warranty Title Llc | |
| Laborg Mike P | $208,000 | Dba Warranty Title Ins Co | |
| Edwin Dillard Mark | -- | -- | |
| Dillard Mark E | $175,000 | -- | |
| Goodwin Ernestine | -- | -- |
Source: Public Records
Mortgage History
| Date | Status | Borrower | Loan Amount |
|---|---|---|---|
| Open | Leard Shananni Lynn | $340,000 |
Source: Public Records
Tax History Compared to Growth
Tax History
| Year | Tax Paid | Tax Assessment Tax Assessment Total Assessment is a certain percentage of the fair market value that is determined by local assessors to be the total taxable value of land and additions on the property. | Land | Improvement |
|---|---|---|---|---|
| 2024 | $1,404 | $78,025 | $9,775 | $68,250 |
| 2023 | $1,404 | $78,025 | $9,775 | $68,250 |
| 2022 | $1,226 | $47,600 | $4,025 | $43,575 |
| 2021 | $945 | $47,600 | $4,025 | $43,575 |
| 2020 | $1,072 | $36,700 | $6,350 | $30,350 |
| 2019 | $1,249 | $48,500 | $6,350 | $42,150 |
| 2018 | $1,249 | $48,500 | $6,350 | $42,150 |
| 2017 | $1,445 | $46,825 | $8,325 | $38,500 |
| 2016 | $1,445 | $46,825 | $8,325 | $38,500 |
| 2015 | $1,386 | $46,825 | $8,325 | $38,500 |
| 2014 | $1,386 | $46,825 | $8,325 | $38,500 |
Source: Public Records
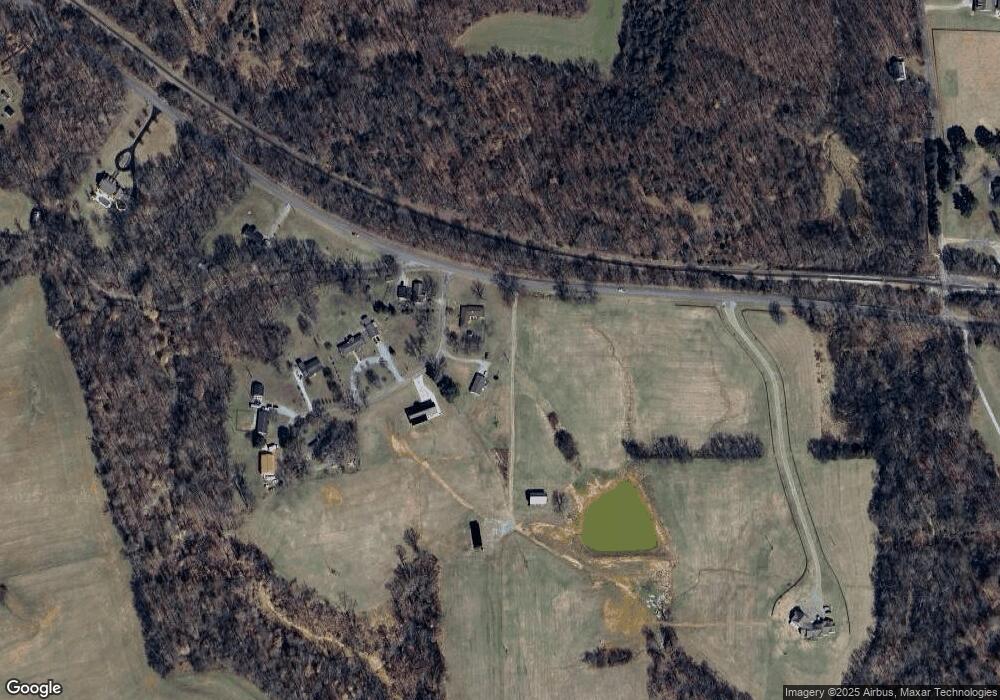
Map
Nearby Homes
- 4108 Airport Rd
- 3863 Felts Rd
- 4231 Airport Rd
- 1421 Lawrence Ln
- 1224 Hangar Dr
- 1191 Hangar Rd
- 461 Berry Cir
- 1 Highway 41n Tn
- 7373 New Chapel Rd
- 3943 Fykes Grove Rd
- 5148 Highway 49 W
- 1503 5th Ave W
- 5058 New Chapel Rd
- 100 Pitt Ln
- 5106 High Oaks Place
- 108 Valley Dr
- 3908 Fykes Grove Rd
- 1100 Goose Dr
- 0 Forest Park Rd Unit RTC3002406
- 0 Forest Park Rd Unit RTC3002403
- 4043 S Hillwood Estates Rd
- 4045 Hillwood Estates Rd
- 4053 Hillwood Estates Rd
- 4054 Hillwood Estates Rd
- 4038 Hillwood Estates Rd
- 4030 Hillwood Estates Rd
- 4027 Hillwood Estates Rd
- 4027 Kinneys Rd
- 4024 Hillwood Estates Rd
- 3989 Kinneys Rd
- 4126 Holman Rd
- 4121 Holman Rd
- 4125 Kinneys Rd
- 3951 Kinneys Rd
- 4135 Holman Rd
- 4147 Kinneys Rd
- 3947 Kinneys Rd
- 4001 Fawn Dr
- 4006 Fawn Dr
- 4008 Fawn Dr