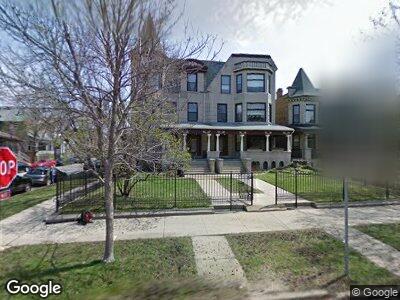
4055 N Greenview Ave Unit 1S Chicago, IL 60613
West Graceland NeighborhoodEstimated Value: $535,000 - $702,000
3
Beds
2
Baths
1,267
Sq Ft
$510/Sq Ft
Est. Value
About This Home
This home is located at 4055 N Greenview Ave Unit 1S, Chicago, IL 60613 and is currently estimated at $646,386, approximately $510 per square foot. 4055 N Greenview Ave Unit 1S is a home located in Cook County with nearby schools including Blaine Elementary School, Lake View High School, and German International School Chicago.
Ownership History
Date
Name
Owned For
Owner Type
Purchase Details
Closed on
May 9, 2011
Sold by
Deveny Alasin
Bought by
Yuen Dan and Mullinnix Jennifer
Current Estimated Value
Home Financials for this Owner
Home Financials are based on the most recent Mortgage that was taken out on this home.
Original Mortgage
$274,500
Interest Rate
4.81%
Mortgage Type
New Conventional
Purchase Details
Closed on
Jul 10, 2008
Sold by
Krucoff Sibyl E
Bought by
Deveny Patrick and Deveny Alasin
Purchase Details
Closed on
Jun 6, 1996
Sold by
Harris Cacinda S and Kuhn Cacinda S
Bought by
Krucoff Sibyl E
Home Financials for this Owner
Home Financials are based on the most recent Mortgage that was taken out on this home.
Original Mortgage
$126,400
Interest Rate
8.29%
Mortgage Type
Balloon
Create a Home Valuation Report for This Property
The Home Valuation Report is an in-depth analysis detailing your home's value as well as a comparison with similar homes in the area
Home Values in the Area
Average Home Value in this Area
Purchase History
| Date | Buyer | Sale Price | Title Company |
|---|---|---|---|
| Yuen Dan | $305,000 | Baird & Warner Title Service | |
| Deveny Patrick | $295,000 | Fort Dearborn Land Title Llc | |
| Krucoff Sibyl E | $158,000 | -- |
Source: Public Records
Mortgage History
| Date | Status | Borrower | Loan Amount |
|---|---|---|---|
| Open | Yuen Dan | $290,000 | |
| Closed | Yuen Dan | $274,500 | |
| Previous Owner | Krucoff Sibyl E | $117,500 | |
| Previous Owner | Krucoff Sibyl E | $126,400 |
Source: Public Records
Tax History Compared to Growth
Tax History
| Year | Tax Paid | Tax Assessment Tax Assessment Total Assessment is a certain percentage of the fair market value that is determined by local assessors to be the total taxable value of land and additions on the property. | Land | Improvement |
|---|---|---|---|---|
| 2024 | $13,694 | $81,986 | $25,698 | $56,288 |
| 2023 | $13,694 | $70,000 | $20,742 | $49,258 |
| 2022 | $13,694 | $70,000 | $20,742 | $49,258 |
| 2021 | $13,406 | $69,999 | $20,742 | $49,257 |
| 2020 | $12,160 | $57,689 | $13,367 | $44,322 |
| 2019 | $11,924 | $62,780 | $13,367 | $49,413 |
| 2018 | $11,723 | $62,780 | $13,367 | $49,413 |
| 2017 | $11,685 | $57,655 | $11,523 | $46,132 |
| 2016 | $11,173 | $58,282 | $11,523 | $46,759 |
| 2015 | $10,782 | $61,462 | $11,523 | $49,939 |
| 2014 | $5,182 | $30,499 | $9,391 | $21,108 |
| 2013 | $7,697 | $44,950 | $9,391 | $35,559 |
Source: Public Records
Map
Nearby Homes
- 1460 W Cuyler Ave
- 1444 W Cuyler Ave
- 1442 W Cuyler Ave
- 1462 W Warner Ave
- 1427 W Warner Ave Unit 1E
- 1426 W Irving Park Rd Unit 4
- 4051 N Southport Ave Unit 1
- 3930 N Greenview Ave Unit 2
- 3926 N Greenview Ave
- 3940 N Ashland Ave Unit 2N
- 3923 N Ashland Ave Unit 201
- 4108 N Paulina St
- 4157 N Paulina St
- 4110 N Paulina St
- 3930 N Southport Ave Unit 2S
- 3946 N Marshfield Ave Unit 1S
- 4221 N Paulina St Unit 2I
- 4045 N Hermitage Ave Unit G
- 4117 N Hermitage Ave
- 1414 W Byron St Unit 3W
- 4055 N Greenview Ave Unit 2S
- 4055 N Greenview Ave Unit 1S
- 4055 N Greenview Ave Unit 1N
- 4055 N Greenview Ave Unit 3S
- 4055 N Greenview Ave Unit 2N
- 4059 N Greenview Ave Unit 3N
- 4059 N Greenview Ave Unit GN
- 4059 N Greenview Ave Unit G
- 4059 N Greenview Ave Unit 3
- 4059 N Greenview Ave Unit 1N
- 4053 N Greenview Ave Unit 1
- 4053 N Greenview Ave
- 4049 N Greenview Ave
- 4045 N Greenview Ave
- 4045 N Greenview Ave
- 1472 W Belle Plaine Ave
- 1459 W Belle Plaine Ave
- 4101 N Greenview Ave
- 1476 W Belle Plaine Ave
- 1468 W Belle Plaine Ave