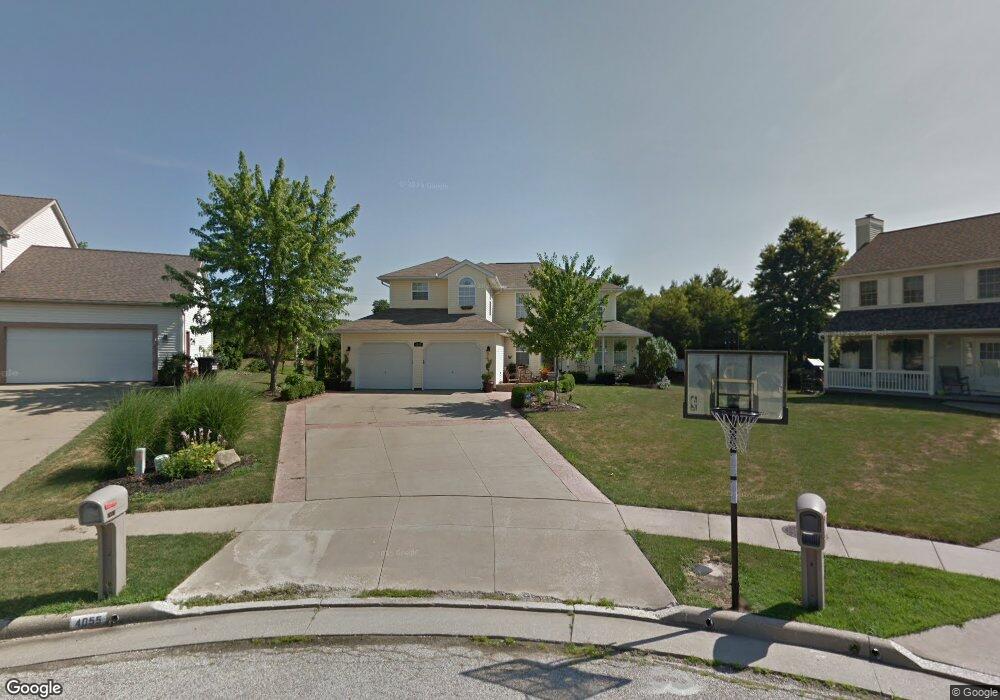
4055 Queensbury Cir Cuyahoga Falls, OH 44224
Estimated Value: $418,704 - $506,000
4
Beds
3
Baths
2,576
Sq Ft
$176/Sq Ft
Est. Value
About This Home
This home is located at 4055 Queensbury Cir, Cuyahoga Falls, OH 44224 and is currently estimated at $452,426, approximately $175 per square foot. 4055 Queensbury Cir is a home located in Summit County with nearby schools including Stow-Munroe Falls High School and St Patrick Elementary School.
Ownership History
Date
Name
Owned For
Owner Type
Purchase Details
Closed on
Aug 28, 2004
Sold by
Dunn Jed R and Dunn Jonalyn T
Bought by
Sikon Francis B and Sikon Debra M
Current Estimated Value
Home Financials for this Owner
Home Financials are based on the most recent Mortgage that was taken out on this home.
Original Mortgage
$180,000
Outstanding Balance
$91,665
Interest Rate
6.3%
Mortgage Type
Purchase Money Mortgage
Estimated Equity
$360,761
Purchase Details
Closed on
Jul 7, 1999
Sold by
Hewitt Boggs Co Inc
Bought by
Dunn Jed R and Dunn Jonalyn T
Home Financials for this Owner
Home Financials are based on the most recent Mortgage that was taken out on this home.
Original Mortgage
$137,000
Interest Rate
7.68%
Create a Home Valuation Report for This Property
The Home Valuation Report is an in-depth analysis detailing your home's value as well as a comparison with similar homes in the area
Home Values in the Area
Average Home Value in this Area
Purchase History
| Date | Buyer | Sale Price | Title Company |
|---|---|---|---|
| Sikon Francis B | $225,000 | Shaker Title Services Corp | |
| Dunn Jed R | $42,000 | Midland Commerce Group |
Source: Public Records
Mortgage History
| Date | Status | Borrower | Loan Amount |
|---|---|---|---|
| Open | Sikon Francis B | $180,000 | |
| Closed | Dunn Jed R | $137,000 | |
| Closed | Sikon Francis B | $45,000 |
Source: Public Records
Tax History Compared to Growth
Tax History
| Year | Tax Paid | Tax Assessment Tax Assessment Total Assessment is a certain percentage of the fair market value that is determined by local assessors to be the total taxable value of land and additions on the property. | Land | Improvement |
|---|---|---|---|---|
| 2025 | $6,790 | $120,838 | $19,201 | $101,637 |
| 2024 | $6,790 | $120,838 | $19,201 | $101,637 |
| 2023 | $6,790 | $120,838 | $19,201 | $101,637 |
| 2022 | $6,009 | $94,406 | $15,001 | $79,405 |
| 2021 | $5,378 | $94,406 | $15,001 | $79,405 |
| 2020 | $5,285 | $94,410 | $15,000 | $79,410 |
| 2019 | $5,179 | $86,470 | $15,000 | $71,470 |
| 2018 | $5,094 | $86,470 | $15,000 | $71,470 |
| 2017 | $4,609 | $86,470 | $15,000 | $71,470 |
| 2016 | $4,744 | $75,960 | $15,000 | $60,960 |
| 2015 | $4,609 | $75,960 | $15,000 | $60,960 |
| 2014 | $4,613 | $75,960 | $15,000 | $60,960 |
| 2013 | $4,310 | $71,370 | $15,000 | $56,370 |
Source: Public Records
Map
Nearby Homes
- 978 Silver Meadows Blvd
- 600 Silver Meadows Blvd
- 4035 Villas Dr
- 4451 Newcomer Rd
- 2908 Wexford Blvd
- 2991 Heatherwood Ct Unit 30B
- 1265 W Main St
- 3165 Peterboro Dr
- 4233 Smokerise Dr
- 3896 Lake Run Blvd
- 940 Kevin Dr
- 2973 Mourning Dove Cir
- 4227 Maribend Dr
- 3127 Deercrest Path
- 3511 Whit Ave
- 1037 Verona Dr
- 3791 Baird Rd
- 4227 Baird Rd
- 1181 Norwood St
- 566 Beech Dr
- 4061 Queensbury Cir
- 4039 Queensbury Cir
- 4052 Queensbury Cir
- 4044 Queensbury Cir
- 4032 Queensbury Cir
- 4031 Queensbury Cir
- 4020 Queensbury Cir
- 4023 Queensbury Cir
- 3197 Courtwood Way
- 3201 Courtwood Way
- 1501 Fairchild Ave
- 3175 Crown Pointe Dr
- 4008 Queensbury Cir
- 4015 Queensbury Cir
- 3183 Crown Pointe Dr
- 3163 Crown Pointe Dr
- 3206 Courtwood Way
- 4035 Kings Mill Blvd
- 4023 Kings Mill Blvd
- 3172 Crown Pointe Dr