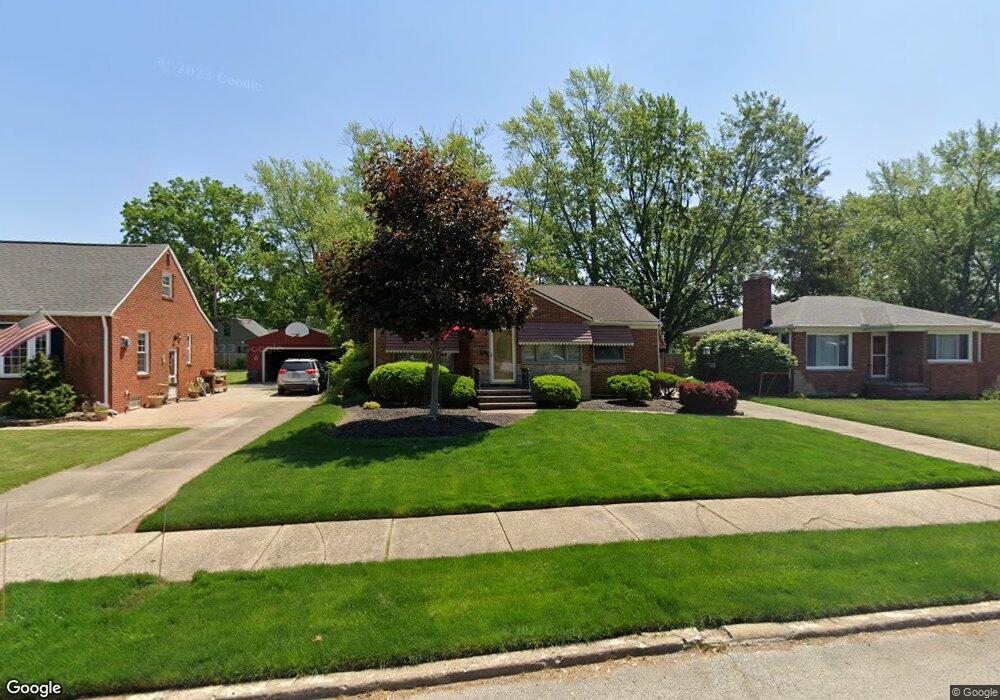
4055 W 222nd St Cleveland, OH 44126
Estimated Value: $249,135 - $308,000
2
Beds
1
Bath
1,315
Sq Ft
$211/Sq Ft
Est. Value
About This Home
This home is located at 4055 W 222nd St, Cleveland, OH 44126 and is currently estimated at $277,034, approximately $210 per square foot. 4055 W 222nd St is a home located in Cuyahoga County with nearby schools including Gilles-Sweet Elementary School, Lewis F Mayer Middle School, and Fairview High School.
Ownership History
Date
Name
Owned For
Owner Type
Purchase Details
Closed on
Jul 27, 2023
Sold by
Jopek Daniel J
Bought by
Daniel J Jopek Irrevocable Family Trust and Jopek
Current Estimated Value
Purchase Details
Closed on
Mar 14, 2002
Sold by
Martino Fay
Bought by
Jopek Daniel J
Home Financials for this Owner
Home Financials are based on the most recent Mortgage that was taken out on this home.
Original Mortgage
$78,000
Interest Rate
7.11%
Purchase Details
Closed on
Jan 17, 1980
Sold by
Martino Joseph and Martino Fay
Bought by
Joseph and Fay Martino
Purchase Details
Closed on
Oct 25, 1979
Sold by
Gregos Joseph
Bought by
Martino Joseph and Martino Fay
Purchase Details
Closed on
Sep 2, 1977
Sold by
Gregos Joseph and Gregos Amelia
Bought by
Gregos Joseph
Purchase Details
Closed on
Jan 1, 1975
Bought by
Gregos Joseph and Gregos Amelia
Create a Home Valuation Report for This Property
The Home Valuation Report is an in-depth analysis detailing your home's value as well as a comparison with similar homes in the area
Home Values in the Area
Average Home Value in this Area
Purchase History
| Date | Buyer | Sale Price | Title Company |
|---|---|---|---|
| Daniel J Jopek Irrevocable Family Trust | -- | None Listed On Document | |
| Jopek Daniel J | $118,000 | Midland Title Security Inc | |
| Joseph | -- | -- | |
| Martino Joseph | $58,000 | -- | |
| Gregos Joseph | -- | -- | |
| Gregos Joseph | -- | -- |
Source: Public Records
Mortgage History
| Date | Status | Borrower | Loan Amount |
|---|---|---|---|
| Previous Owner | Jopek Daniel J | $78,000 |
Source: Public Records
Tax History Compared to Growth
Tax History
| Year | Tax Paid | Tax Assessment Tax Assessment Total Assessment is a certain percentage of the fair market value that is determined by local assessors to be the total taxable value of land and additions on the property. | Land | Improvement |
|---|---|---|---|---|
| 2024 | $5,114 | $73,990 | $16,030 | $57,960 |
| 2023 | $4,952 | $61,390 | $14,350 | $47,040 |
| 2022 | $4,829 | $61,390 | $14,350 | $47,040 |
| 2021 | $4,929 | $61,390 | $14,350 | $47,040 |
| 2020 | $4,536 | $49,530 | $11,590 | $37,940 |
| 2019 | $4,034 | $141,500 | $33,100 | $108,400 |
| 2018 | $4,041 | $49,530 | $11,590 | $37,940 |
| 2017 | $3,913 | $44,390 | $10,330 | $34,060 |
| 2016 | $3,887 | $44,390 | $10,330 | $34,060 |
| 2015 | $3,672 | $44,390 | $10,330 | $34,060 |
| 2014 | $3,672 | $42,290 | $9,840 | $32,450 |
Source: Public Records
Map
Nearby Homes
- 4140 W 220th St
- 4036 W 219th St
- 22377 Rivergate Dr
- 4235 W 222nd St
- 3913 W 227th St
- 3520 Archwood Dr
- 4291 W 215th St
- 3733 River Ln
- 3534 Palmer Dr
- 22788 Vine Ct
- 21237 Westwood Rd
- 4267 W 226th St
- 4243 W 212th St
- 21236 Northwood Ave
- 21143 Westwood Rd
- 23045 Clifford Dr
- 21872 Addington Blvd Unit 15
- 22555 Center Ridge Rd Unit 403
- 23181 Marion Rd
- 21503 Hillsdale Ave
- 4047 W 222nd St
- 4063 W 222nd St
- 4039 W 222nd St
- 4071 W 222nd St
- 4078 W 220th St
- 4070 W 220th St
- 4086 W 220th St
- 4031 W 222nd St
- 4079 W 222nd St
- 4062 W 220th St
- 4096 W 220th St
- 4054 W 222nd St
- 4046 W 222nd St
- 4062 W 222nd St
- 4023 W 222nd St
- 4087 W 222nd St
- 4038 W 222nd St
- 4054 W 220th St
- 4106 W 220th St
- 4070 W 222nd St