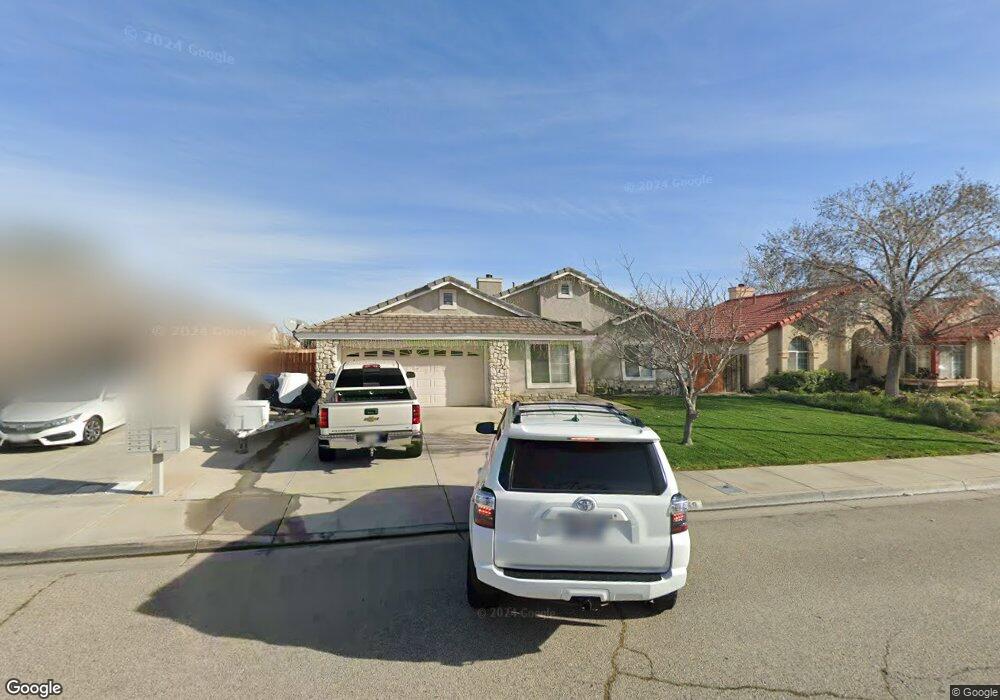
4059 Belleshire Way Palmdale, CA 93552
East Palmdale NeighborhoodEstimated Value: $384,000 - $425,897
2
Beds
2
Baths
1,284
Sq Ft
$314/Sq Ft
Est. Value
About This Home
This home is located at 4059 Belleshire Way, Palmdale, CA 93552 and is currently estimated at $403,224, approximately $314 per square foot. 4059 Belleshire Way is a home located in Los Angeles County with nearby schools including Mesquite Elementary School, Cactus Magnet Academy, and Knight High School.
Ownership History
Date
Name
Owned For
Owner Type
Purchase Details
Closed on
Aug 21, 2009
Sold by
Graham Nora
Bought by
Montiel Jose R
Current Estimated Value
Home Financials for this Owner
Home Financials are based on the most recent Mortgage that was taken out on this home.
Original Mortgage
$117,826
Outstanding Balance
$76,548
Interest Rate
5.14%
Mortgage Type
FHA
Estimated Equity
$326,676
Purchase Details
Closed on
May 6, 2008
Sold by
Deldotto Suzan M
Bought by
Deldotto Suzan and Del Dotto Trust
Purchase Details
Closed on
Mar 21, 2002
Sold by
Deldotto Suzan M
Bought by
Deldotto Suzan M and Musselman Mary Kathryn
Purchase Details
Closed on
Dec 14, 1998
Sold by
Smith Matthew A
Bought by
Deldotto Suzan
Home Financials for this Owner
Home Financials are based on the most recent Mortgage that was taken out on this home.
Original Mortgage
$40,000
Interest Rate
6.63%
Create a Home Valuation Report for This Property
The Home Valuation Report is an in-depth analysis detailing your home's value as well as a comparison with similar homes in the area
Home Values in the Area
Average Home Value in this Area
Purchase History
We collect this data history from publicly available records. To have your information removed, we recommend requesting removal directly through your county’s website.
| Date | Buyer | Sale Price | Title Company |
|---|---|---|---|
| Montiel Jose R | $125,000 | Chicago Title Company | |
| Deldotto Suzan | -- | None Available | |
| Deldotto Suzan M | -- | -- | |
| Deldotto Suzan | $70,000 | Lawyers Title Company |
Source: Public Records
Mortgage History
We collect this data history from publicly available records. To have your information removed, we recommend requesting removal directly through your county’s website.
| Date | Status | Borrower | Loan Amount |
|---|---|---|---|
| Open | Montiel Jose R | $117,826 | |
| Previous Owner | Deldotto Suzan | $40,000 |
Source: Public Records
Tax History
| Year | Tax Paid | Tax Assessment Tax Assessment Total Assessment is a certain percentage of the fair market value that is determined by local assessors to be the total taxable value of land and additions on the property. | Land | Improvement |
|---|---|---|---|---|
| 2025 | $3,668 | $161,337 | $38,717 | $122,620 |
| 2024 | $3,668 | $158,174 | $37,958 | $120,216 |
| 2023 | $3,636 | $155,073 | $37,214 | $117,859 |
| 2022 | $3,513 | $152,034 | $36,485 | $115,549 |
| 2021 | $3,431 | $149,054 | $35,770 | $113,284 |
| 2019 | $3,328 | $144,635 | $34,710 | $109,925 |
| 2018 | $3,278 | $141,800 | $34,030 | $107,770 |
| 2016 | $3,087 | $136,295 | $32,709 | $103,586 |
| 2015 | $3,055 | $134,249 | $32,218 | $102,031 |
| 2014 | $3,024 | $131,620 | $31,587 | $100,033 |
Source: Public Records
Map
Nearby Homes
- 37940 42nd St E Unit 125
- 37940 42nd St E Unit 115
- 3811 Triton Dr
- 4444 E R Ave
- 4444 E Avenue R Unit 16
- 4444 E Avenue R
- 4444 E Avenue R Unit 143
- 37513 Penara St
- 4228 Trenton Ave
- 4111 Saddleback Rd
- 0 E Avenue R Unit IV26070798
- 0 E Avenue R Unit 26002631
- 4537 Elwood Ave
- 37900 Janus Dr
- 37526 Daybreak St
- 37401 Richmond St
- 4554 Moonraker Rd
- 4112 Lexington Ct
- 4625 E Avenue r6
- 37422 Morning Cir
- 4055 Belleshire Way
- 4063 Belleshire Way
- 37767 Scorpius Way
- 4051 Belleshire Way
- 4067 Belleshire Way
- 4144 Pegasus Way
- 37766 Leo Cir
- 4052 Belleshire Way
- 4056 Belleshire Way
- 4047 Belleshire Way
- 4048 Belleshire Way
- 4152 Pegasus Way
- 4060 Belleshire Way
- 37773 Scorpius Way
- 37772 Leo Cir
- 4064 Belleshire Way
- 4043 Belleshire Way
- 4160 Pegasus Way
- 37765 Leo Cir
- 4079 E Avenue r6
Your Personal Tour Guide
Ask me questions while you tour the home.