4063 Forseman Point Dr NW Hackensack, MN 56452
Estimated Value: $667,000 - $894,000
3
Beds
2
Baths
1,704
Sq Ft
$459/Sq Ft
Est. Value
About This Home
This home is located at 4063 Forseman Point Dr NW, Hackensack, MN 56452 and is currently estimated at $782,904, approximately $459 per square foot. 4063 Forseman Point Dr NW is a home with nearby schools including WHA Elementary School and Walker Hackensack Akeley High School.
Ownership History
Date
Name
Owned For
Owner Type
Purchase Details
Closed on
Jul 23, 2025
Sold by
Blomme Jean M and Blomme Richard F
Bought by
Jean M Blomme And Richard F Blomme Trust and Blomme
Current Estimated Value
Purchase Details
Closed on
May 30, 2007
Sold by
Hemmerich Earl and Hemmerich Jeannine
Bought by
Blomme Richard F and Blomme Jean M
Purchase Details
Closed on
Oct 13, 2006
Sold by
Hemmerich Earl and Hemmerich Jeannine
Bought by
Benike Troy A and Benike Laura L
Home Financials for this Owner
Home Financials are based on the most recent Mortgage that was taken out on this home.
Original Mortgage
$348,300
Interest Rate
6.5%
Mortgage Type
Purchase Money Mortgage
Purchase Details
Closed on
Oct 11, 2006
Sold by
Hiram Township
Bought by
Hemmerich Earl and Hemmerich Jeannine
Home Financials for this Owner
Home Financials are based on the most recent Mortgage that was taken out on this home.
Original Mortgage
$348,300
Interest Rate
6.5%
Mortgage Type
Purchase Money Mortgage
Create a Home Valuation Report for This Property
The Home Valuation Report is an in-depth analysis detailing your home's value as well as a comparison with similar homes in the area
Purchase History
| Date | Buyer | Sale Price | Title Company |
|---|---|---|---|
| Jean M Blomme And Richard F Blomme Trust | $500 | None Listed On Document | |
| Blomme Richard F | $390,000 | Complete Title Services Llc | |
| Benike Troy A | $387,000 | Complete Title Services Llc | |
| Hemmerich Earl | -- | None Available |
Source: Public Records
Mortgage History
| Date | Status | Borrower | Loan Amount |
|---|---|---|---|
| Previous Owner | Benike Troy A | $348,300 |
Source: Public Records
Tax History
| Year | Tax Paid | Tax Assessment Tax Assessment Total Assessment is a certain percentage of the fair market value that is determined by local assessors to be the total taxable value of land and additions on the property. | Land | Improvement |
|---|---|---|---|---|
| 2025 | $3,136 | $685,400 | $312,000 | $373,400 |
| 2024 | $3,136 | $728,900 | $352,000 | $376,900 |
| 2023 | $2,996 | $698,000 | $352,000 | $346,000 |
| 2022 | $3,056 | $698,000 | $352,000 | $346,000 |
| 2021 | $3,204 | $546,600 | $318,000 | $228,600 |
| 2020 | $3,332 | $547,700 | $318,000 | $229,700 |
| 2019 | $3,138 | $520,400 | $318,000 | $202,400 |
| 2018 | $3,132 | $516,800 | $348,000 | $168,800 |
| 2017 | $3,086 | $516,800 | $348,000 | $168,800 |
| 2016 | $2,732 | $0 | $0 | $0 |
| 2015 | $2,732 | $477,000 | $338,000 | $139,000 |
| 2014 | $2,572 | $0 | $0 | $0 |
Source: Public Records
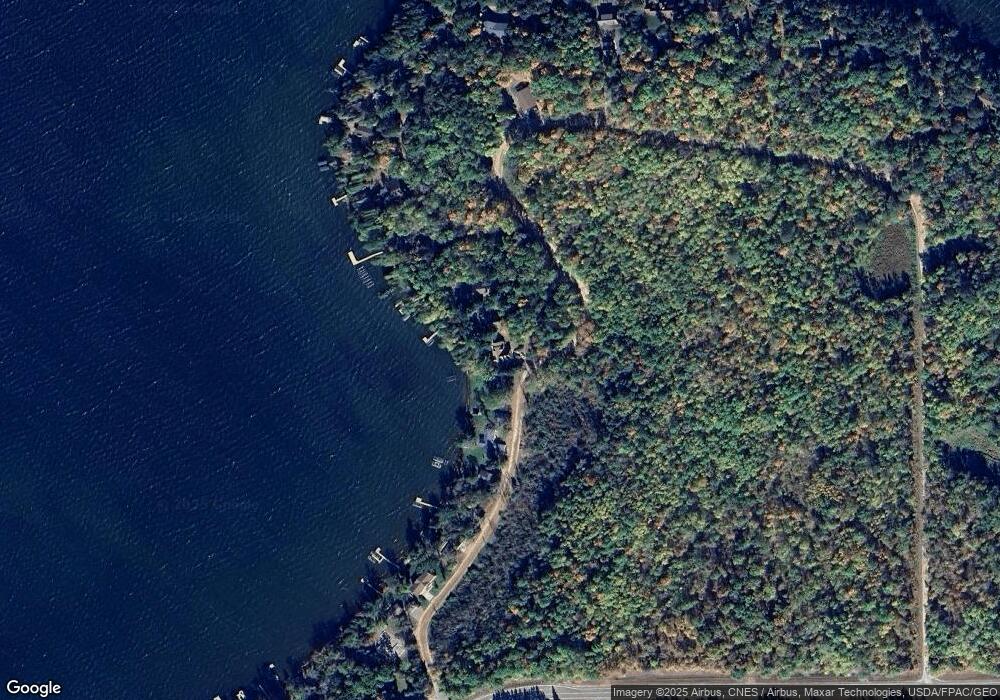
Map
Nearby Homes
- 4055 Forseman Point Dr NW
- 5814 36th St NW
- 5020 Woodland Dr NW
- 5568 50th St NW
- 3403 68th Ave NW
- 5057 County 40 NW
- TBD County Road 12
- 5159 Rocky Ridge Rd NW
- 136 1st St N
- 209 Park Ave W
- TBD Variety Lake Dr NW
- 20551 County 12
- 230 Whipple Ave E
- 5309 Howard Lake Rd NW
- 4388 Robin Ln NW
- 5298 Scenic Lake Rd NW
- 3174 County 5 NW
- 6828 Aurora Dr
- TBD-3 Christmas Point Rd NW
- 24996 Horseshoe Rd
- 4065 Forseman Point Dr NW
- 4067 Forseman Point Dr NW
- 4049 Forseman Point Dr NW
- 4041 Forseman Point Dr NW
- 4071 Forseman Point Dr NW
- 4035 Forseman Point Dr NW
- 4077 Forseman Point Dr NW
- 4027 Forseman Point Dr NW
- 4079 Forseman Point Dr NW
- 4017 Forseman Point Dr NW
- 4081 Forseman Point Dr NW
- 4083 Forseman Point Dr NW
- 4089 Forseman Point Dr NW
- 4089 Forseman Point Dr NW
- 4089 Hiram Township 9
- 4953099 Hiram Township 9
- 000 Lower Ten Mile Lake-Road-nw
- 54459 Lower Ten Mile Lake Rd NW
- 0 Lower Ten Mile Lake Rd NW Unit 4458169
- 4085 Forseman Point Dr NW
Your Personal Tour Guide
Ask me questions while you tour the home.