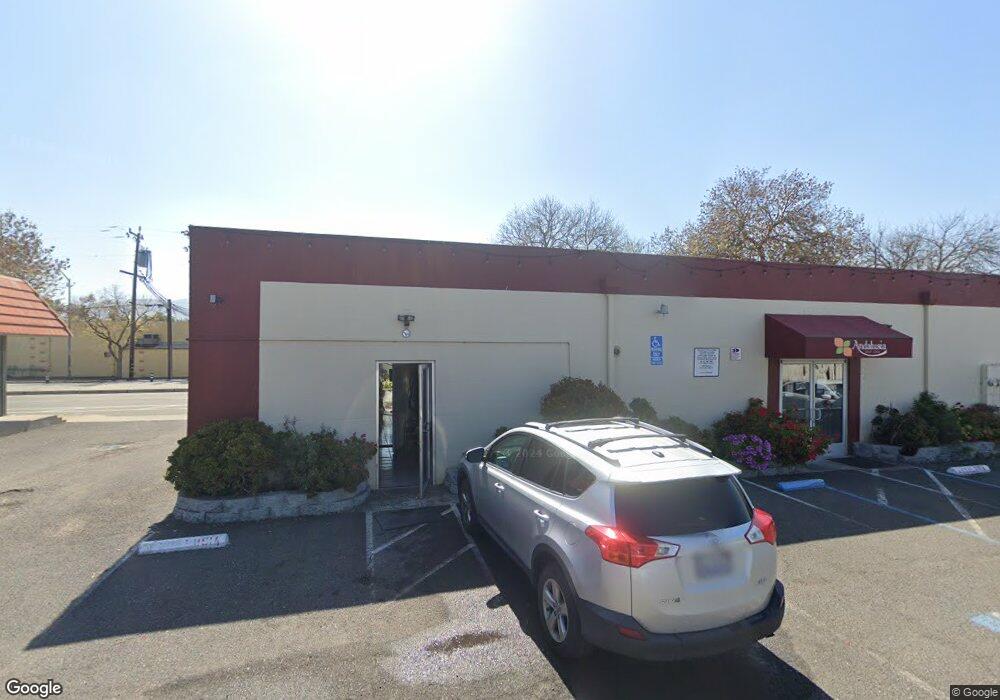
40641 Grimmer Blvd Fremont, CA 94538
Sundale NeighborhoodEstimated Value: $1,431,916
--
Bed
--
Bath
3,000
Sq Ft
$477/Sq Ft
Est. Value
About This Home
This home is located at 40641 Grimmer Blvd, Fremont, CA 94538 and is currently estimated at $1,431,916, approximately $477 per square foot. 40641 Grimmer Blvd is a home located in Alameda County with nearby schools including John Blacow Elementary School, G.M. Walters Middle School, and John F. Kennedy High School.
Ownership History
Date
Name
Owned For
Owner Type
Purchase Details
Closed on
Feb 6, 2025
Sold by
Shoker Devinder S and Shoker Rajwant Kaur
Bought by
Shoker Family Trust and Shoker
Current Estimated Value
Purchase Details
Closed on
Feb 23, 2021
Sold by
Verra Grimmer Llc
Bought by
Shoker Devinder S and Shoker Rajwant K
Purchase Details
Closed on
May 10, 2017
Sold by
Aggarwal Rohit and Aggarwal Prerna
Bought by
Veera Grimmer Llc
Purchase Details
Closed on
Nov 8, 2016
Sold by
Bernstein Polina and The Bernstein 2010 Trust
Bought by
Aggarwal Rohit and Aggarwal Prerna
Purchase Details
Closed on
May 28, 2010
Sold by
Bernstein Polina and Bernstein 1999 Trust
Bought by
Bernstein Polina and Bernstein 2010 Trust
Purchase Details
Closed on
Jan 12, 1999
Sold by
Bernstein Anatoly and Bernstein Polina
Bought by
Bernstein Anatoly and Bernstein Polina
Create a Home Valuation Report for This Property
The Home Valuation Report is an in-depth analysis detailing your home's value as well as a comparison with similar homes in the area
Home Values in the Area
Average Home Value in this Area
Purchase History
| Date | Buyer | Sale Price | Title Company |
|---|---|---|---|
| Shoker Family Trust | -- | None Listed On Document | |
| Shoker Devinder S | $1,087,500 | Old Republic Title Company | |
| Veera Grimmer Llc | -- | None Available | |
| Aggarwal Rohit | $900,000 | Old Republic Title Company | |
| Bernstein Polina | -- | None Available | |
| Bernstein Anatoly | -- | -- |
Source: Public Records
Tax History Compared to Growth
Tax History
| Year | Tax Paid | Tax Assessment Tax Assessment Total Assessment is a certain percentage of the fair market value that is determined by local assessors to be the total taxable value of land and additions on the property. | Land | Improvement |
|---|---|---|---|---|
| 2025 | $13,910 | $1,176,915 | $541,210 | $635,705 |
| 2024 | $13,910 | $1,153,842 | $530,600 | $623,242 |
| 2023 | $13,578 | $1,131,226 | $520,200 | $611,026 |
| 2022 | $13,430 | $1,109,046 | $510,000 | $599,046 |
| 2021 | $11,649 | $964,971 | $643,314 | $321,657 |
| 2020 | $11,983 | $955,080 | $636,720 | $318,360 |
| 2019 | $11,701 | $936,360 | $624,240 | $312,120 |
| 2018 | $11,555 | $918,000 | $612,000 | $306,000 |
| 2017 | $11,397 | $900,000 | $600,000 | $300,000 |
| 2016 | $5,356 | $366,111 | $111,737 | $254,374 |
| 2015 | $5,621 | $360,614 | $110,059 | $250,555 |
| 2014 | $5,330 | $353,552 | $107,904 | $245,648 |
Source: Public Records
Map
Nearby Homes
- 40702 Greystone Terrace Unit 9
- 4214 Providence Terrace
- 4310 Providence Terrace
- 40708 Fremont Blvd
- 40769 Squill Common
- 4463 Hyde Common Unit 306
- 4421 Cahill St
- 4453 Porter St
- 40469 Shaw Ct
- 40425 Chapel Way Unit 214
- 40425 Chapel Way Unit 309
- 39993 Fremont Blvd Unit 102
- 40116 Crockett St
- 3909 Stevenson Blvd Unit 402
- 41212 Fremont Blvd
- 40696 Robin St
- 3695 Stevenson Blvd Unit E206
- 4555 Stevenson Blvd
- 3800 Adams Ave
- 3918 Fossano Common
- 4122 Eugene St
- 4132 Eugene St
- 4112 Eugene St
- 4142 Eugene St
- 4102 Eugene St
- 40577 Grimmer Blvd
- 4152 Eugene St
- 4076 Eugene St
- 4162 Eugene St
- 40480 Foster St
- 40487 Blanchard St
- 4062 Eugene St
- 40675 Grimmer Blvd
- 4172 Eugene St
- 40472 Foster St
- 40477 Foster St
- 40479 Blanchard St
- 4182 Eugene St
- 40484 Blanchard St
- 40469 Foster St