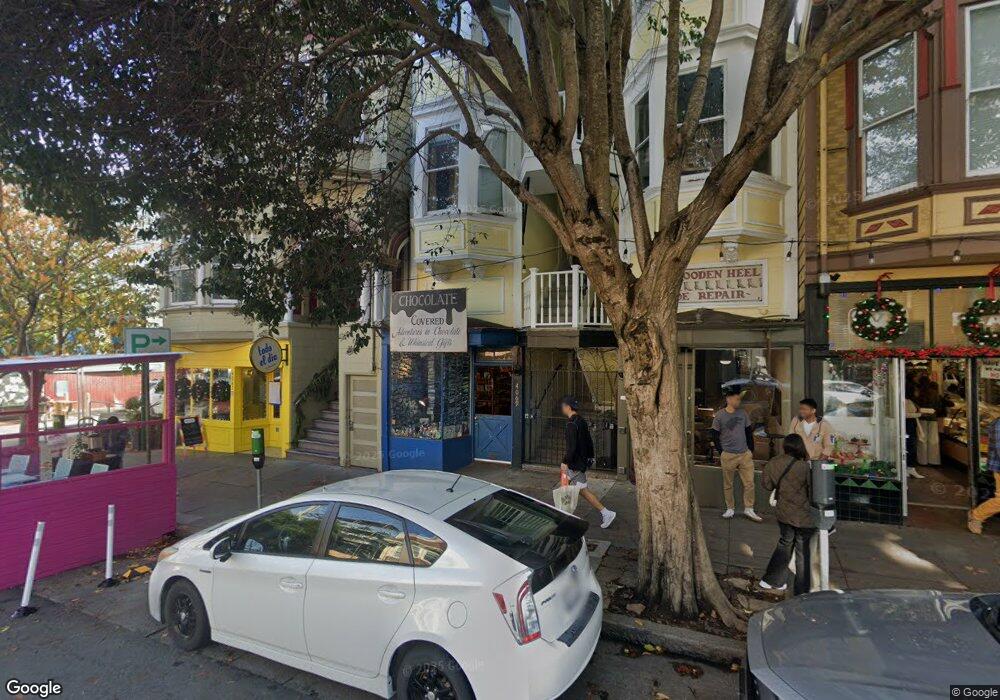
4069-4071 24th St San Francisco, CA 94114
Noe Valley NeighborhoodEstimated Value: $2,895,000
2
Beds
1
Bath
975
Sq Ft
$2,969/Sq Ft
Est. Value
About This Home
This home is located at 4069-4071 24th St, San Francisco, CA 94114 and is currently priced at $2,895,000, approximately $2,969 per square foot. 4069-4071 24th St is a home located in San Francisco County with nearby schools including Alvarado Elementary, James Lick Middle School, and Creative Arts Charter School.
Ownership History
Date
Name
Owned For
Owner Type
Purchase Details
Closed on
Sep 25, 2013
Sold by
Lee Jerry and Lee Angela C
Bought by
Lee Jerry and Lee Angela C
Current Estimated Value
Home Financials for this Owner
Home Financials are based on the most recent Mortgage that was taken out on this home.
Original Mortgage
$1,200,000
Outstanding Balance
$901,358
Interest Rate
4.49%
Mortgage Type
Stand Alone Refi Refinance Of Original Loan
Purchase Details
Closed on
Dec 4, 2006
Sold by
Jerry & Angela C Lee Family Fund
Bought by
Lee Jerry and Lee Angela C
Purchase Details
Closed on
Nov 22, 2005
Sold by
Lee Mary
Bought by
Jerry & Angela C Lee Family Fund
Home Financials for this Owner
Home Financials are based on the most recent Mortgage that was taken out on this home.
Original Mortgage
$900,000
Interest Rate
6.07%
Mortgage Type
Purchase Money Mortgage
Create a Home Valuation Report for This Property
The Home Valuation Report is an in-depth analysis detailing your home's value as well as a comparison with similar homes in the area
Home Values in the Area
Average Home Value in this Area
Purchase History
| Date | Buyer | Sale Price | Title Company |
|---|---|---|---|
| Lee Jerry | -- | Fidelity National Title Co | |
| Lee Jerry | -- | None Available | |
| Jerry & Angela C Lee Family Fund | -- | Fidelity National Title Co |
Source: Public Records
Mortgage History
| Date | Status | Borrower | Loan Amount |
|---|---|---|---|
| Open | Lee Jerry | $1,200,000 | |
| Previous Owner | Jerry & Angela C Lee Family Fund | $900,000 |
Source: Public Records
Tax History Compared to Growth
Tax History
| Year | Tax Paid | Tax Assessment Tax Assessment Total Assessment is a certain percentage of the fair market value that is determined by local assessors to be the total taxable value of land and additions on the property. | Land | Improvement |
|---|---|---|---|---|
| 2025 | $10,564 | $679,483 | $226,482 | $453,001 |
| 2024 | $10,564 | $666,161 | $222,042 | $444,119 |
| 2023 | $10,289 | $653,100 | $217,689 | $435,411 |
| 2022 | $10,068 | $640,295 | $213,421 | $426,874 |
| 2021 | $9,850 | $627,741 | $209,237 | $418,504 |
| 2020 | $10,103 | $621,618 | $207,092 | $414,526 |
| 2019 | $9,669 | $609,437 | $203,032 | $406,405 |
| 2018 | $9,383 | $597,494 | $199,051 | $398,443 |
| 2017 | $8,994 | $585,786 | $195,149 | $390,637 |
| 2016 | $8,839 | $574,307 | $191,323 | $382,984 |
| 2015 | $8,705 | $565,686 | $188,450 | $377,236 |
| 2014 | $8,489 | $554,612 | $184,759 | $369,853 |
Source: Public Records
Map
Nearby Homes
- 222 Jersey St
- 1040 Sanchez St
- 4149 26th St
- 4258 26th St
- 228 Vicksburg St Unit 3
- 3879 23rd St
- 4040 Cesar Chavez
- 734 Elizabeth St
- 3821 23rd St
- 833 Douglass St
- 3936 26th St
- 729 Douglass St
- 729 Douglass St Unit A
- 1161 Church St
- 1325 Church St
- 38 Newburg St
- 561 Duncan St
- 1463 Noe St
- 1474 Noe St
- 376 Hill St
- 4067 24th St Unit 102
- 4067 24th St
- 4069 24th St
- 4063 24th St
- 4049 24th St Unit 4051
- 368 Jersey St
- 362 Jersey St
- 372 Jersey St Unit 374
- 358 Jersey St
- 354 Jersey St
- 1305 Castro St
- 1301 Castro St
- 350 Jersey St
- 4065 24th St
- 4065 24th St Unit 3
- 4054 24th St
- 4074 24th St Unit 1
- 342 Jersey St
- 4046 24th St
- 4035 24th St