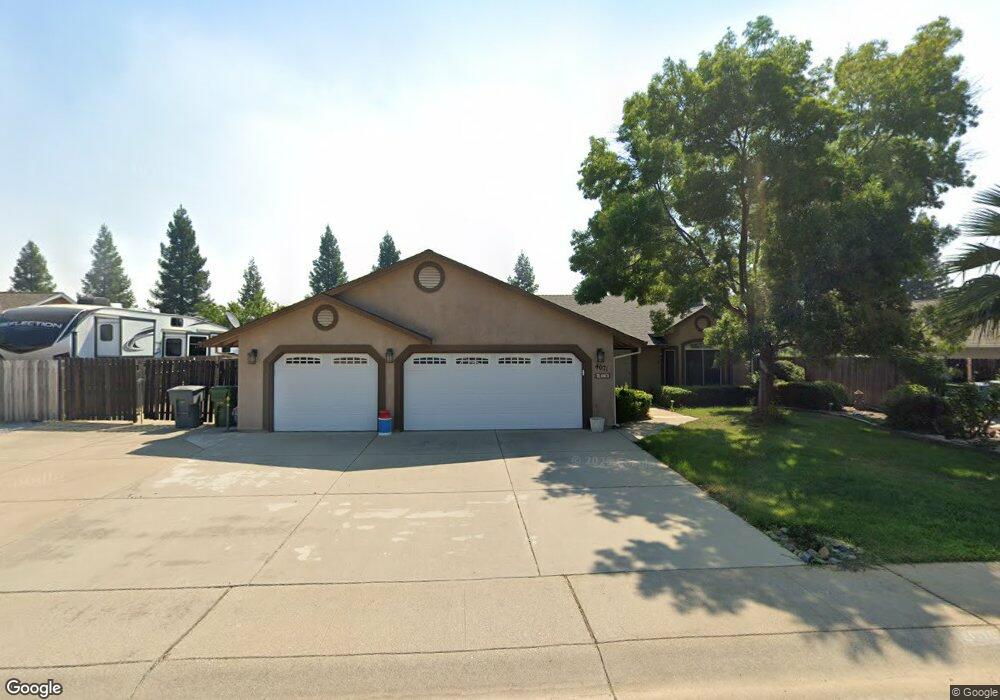
4071 Saffron Way Redding, CA 96002
Forest Hills NeighborhoodEstimated Value: $404,000 - $453,362
4
Beds
2
Baths
1,676
Sq Ft
$261/Sq Ft
Est. Value
About This Home
This home is located at 4071 Saffron Way, Redding, CA 96002 and is currently estimated at $436,841, approximately $260 per square foot. 4071 Saffron Way is a home located in Shasta County with nearby schools including Alta Mesa Elementary School, Parsons Junior High School, and Enterprise High School.
Ownership History
Date
Name
Owned For
Owner Type
Purchase Details
Closed on
Mar 15, 2012
Sold by
Blanco Debra Diane Collins and Blanco Salvatore P
Bought by
Blanco Debra Diane Collins and Blanco Salvatore P
Current Estimated Value
Purchase Details
Closed on
Oct 10, 2011
Sold by
Ellis Shirley A
Bought by
Blanco Salvatore P and Blanco Debra Collins
Purchase Details
Closed on
Jun 9, 2006
Sold by
Ellis Michael L
Bought by
Ellis Shirley A
Home Financials for this Owner
Home Financials are based on the most recent Mortgage that was taken out on this home.
Original Mortgage
$312,000
Interest Rate
6.55%
Mortgage Type
Fannie Mae Freddie Mac
Purchase Details
Closed on
Oct 15, 2003
Sold by
Shasta View Investments
Bought by
Ellis Michael L and Ellis Shirley A
Home Financials for this Owner
Home Financials are based on the most recent Mortgage that was taken out on this home.
Original Mortgage
$231,000
Interest Rate
5.62%
Mortgage Type
Purchase Money Mortgage
Create a Home Valuation Report for This Property
The Home Valuation Report is an in-depth analysis detailing your home's value as well as a comparison with similar homes in the area
Home Values in the Area
Average Home Value in this Area
Purchase History
| Date | Buyer | Sale Price | Title Company |
|---|---|---|---|
| Blanco Debra Diane Collins | -- | None Available | |
| Blanco Salvatore P | $232,000 | Fidelity Natl Title Co Of Ca | |
| Ellis Shirley A | -- | Fidelity Natl Title Co Of Ca | |
| Ellis Michael L | $246,500 | Alliance Title Company |
Source: Public Records
Mortgage History
| Date | Status | Borrower | Loan Amount |
|---|---|---|---|
| Previous Owner | Ellis Shirley A | $312,000 | |
| Previous Owner | Ellis Michael L | $231,000 |
Source: Public Records
Tax History
| Year | Tax Paid | Tax Assessment Tax Assessment Total Assessment is a certain percentage of the fair market value that is determined by local assessors to be the total taxable value of land and additions on the property. | Land | Improvement |
|---|---|---|---|---|
| 2025 | $3,161 | $291,392 | $52,749 | $238,643 |
| 2024 | $3,117 | $285,679 | $51,715 | $233,964 |
| 2023 | $3,117 | $280,078 | $50,701 | $229,377 |
| 2022 | $3,029 | $274,587 | $49,707 | $224,880 |
| 2021 | $2,927 | $269,204 | $48,733 | $220,471 |
| 2020 | $2,914 | $266,445 | $48,234 | $218,211 |
| 2019 | $2,890 | $261,222 | $47,289 | $213,933 |
| 2018 | $2,856 | $256,101 | $46,362 | $209,739 |
| 2017 | $2,904 | $251,080 | $45,453 | $205,627 |
| 2016 | $2,719 | $246,158 | $44,562 | $201,596 |
| 2015 | $2,697 | $242,461 | $43,893 | $198,568 |
| 2014 | $2,677 | $237,713 | $43,034 | $194,679 |
Source: Public Records
Map
Nearby Homes
- 2875 Eastbrook Dr
- 3733 Capricorn Way
- 2427 Castlewood Dr
- 3792 Thomason Trail
- 2704 Western Oak Dr
- 3688 Polaris Way
- 3512 Capricorn Way
- 3030 Clear Water Ct
- 3183 Agassi Ln
- 3685 Wimbledon Dr
- 2498 Saturn Skyway
- 2332 Venus Way
- 3874 Palm Springs Dr
- 3594 Laramie St
- 2366 Templeton Dr
- 2354 Suzette Ave
- 3385 Wimbledon Dr
- 0 Shasta View Unit 25-1945
- 2068 Solar Way
- 3361 Alta Mesa Dr
- 4057 Saffron Way
- 4085 Saffron Way
- 4043 Saffron Way
- 4086 Saffron Way
- 4098 Saffron Way
- 4074 Saffron Way
- 4099 Saffron Way
- 2993 Newbury Ln
- 4029 Saffron Way
- 4062 Saffron Way
- 2963 Newbury Ln
- 3965 Meadow Oak Way
- 3985 Meadow Oak Way
- 3945 Meadow Oak Way
- 4050 Saffron Way
- 2933 Newbury Ln
- 4015 Saffron Way
- 3925 Meadow Oak Way
- 4038 Saffron Way
- 3905 Meadow Oak Way
Your Personal Tour Guide
Ask me questions while you tour the home.