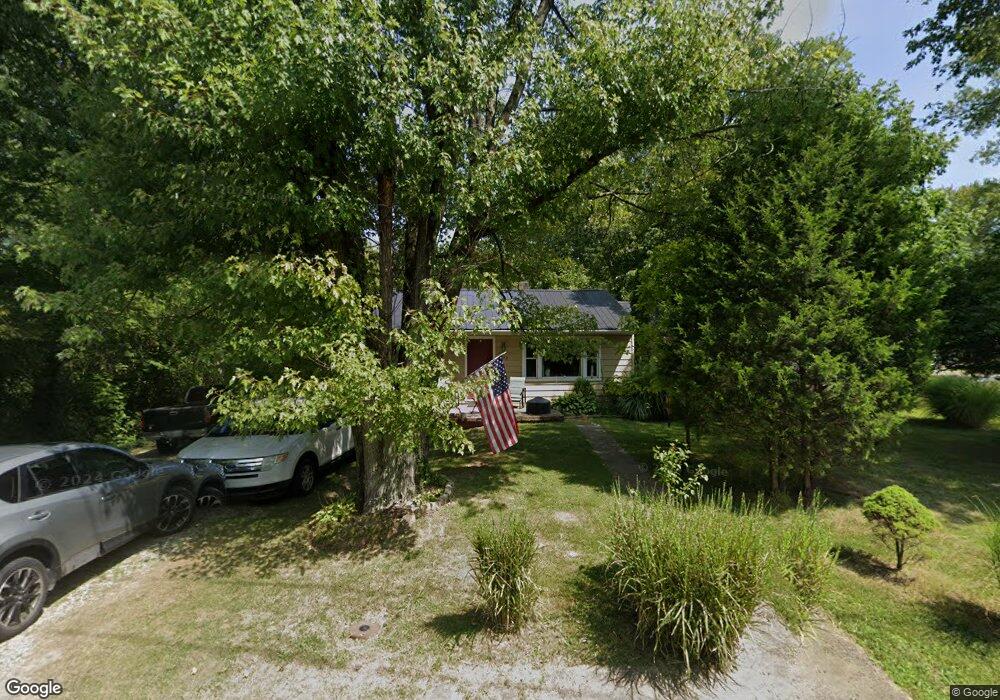
4072 Glen Este-Withamsville Rd Cincinnati, OH 45245
Estimated Value: $200,000 - $241,000
3
Beds
2
Baths
1,140
Sq Ft
$195/Sq Ft
Est. Value
About This Home
This home is located at 4072 Glen Este-Withamsville Rd, Cincinnati, OH 45245 and is currently estimated at $221,964, approximately $194 per square foot. 4072 Glen Este-Withamsville Rd is a home located in Clermont County with nearby schools including Clough Pike Elementary School, West Clermont Middle School, and West Clermont High School.
Ownership History
Date
Name
Owned For
Owner Type
Purchase Details
Closed on
Apr 13, 2007
Sold by
Turner Lonnie and Turner Linda
Bought by
Davis Matthew J and Cassidy Shayna L
Current Estimated Value
Home Financials for this Owner
Home Financials are based on the most recent Mortgage that was taken out on this home.
Original Mortgage
$123,000
Outstanding Balance
$74,533
Interest Rate
6.19%
Mortgage Type
Unknown
Estimated Equity
$147,431
Purchase Details
Closed on
Jul 17, 2006
Sold by
Ocwen Loan Servicing Llc
Bought by
Turner Lonnie and Turner Linda
Home Financials for this Owner
Home Financials are based on the most recent Mortgage that was taken out on this home.
Original Mortgage
$73,880
Interest Rate
6.5%
Mortgage Type
Unknown
Purchase Details
Closed on
Jan 19, 2006
Sold by
Dopf William D
Bought by
Ocwen Federal Bank Fsb
Purchase Details
Closed on
Aug 1, 1988
Create a Home Valuation Report for This Property
The Home Valuation Report is an in-depth analysis detailing your home's value as well as a comparison with similar homes in the area
Home Values in the Area
Average Home Value in this Area
Purchase History
| Date | Buyer | Sale Price | Title Company |
|---|---|---|---|
| Davis Matthew J | $123,000 | Attorney | |
| Turner Lonnie | $69,000 | None Available | |
| Ocwen Federal Bank Fsb | $70,000 | None Available | |
| -- | $49,900 | -- |
Source: Public Records
Mortgage History
| Date | Status | Borrower | Loan Amount |
|---|---|---|---|
| Open | Davis Matthew J | $123,000 | |
| Previous Owner | Turner Lonnie | $73,880 |
Source: Public Records
Tax History Compared to Growth
Tax History
| Year | Tax Paid | Tax Assessment Tax Assessment Total Assessment is a certain percentage of the fair market value that is determined by local assessors to be the total taxable value of land and additions on the property. | Land | Improvement |
|---|---|---|---|---|
| 2024 | $2,327 | $46,140 | $13,900 | $32,240 |
| 2023 | $2,330 | $46,140 | $13,900 | $32,240 |
| 2022 | $2,009 | $34,480 | $10,400 | $24,080 |
| 2021 | $2,017 | $34,480 | $10,400 | $24,080 |
| 2020 | $2,019 | $34,480 | $10,400 | $24,080 |
| 2019 | $1,631 | $32,560 | $9,910 | $22,650 |
| 2018 | $1,648 | $32,560 | $9,910 | $22,650 |
| 2017 | $1,669 | $32,560 | $9,910 | $22,650 |
| 2016 | $1,820 | $32,560 | $9,910 | $22,650 |
| 2015 | $1,766 | $32,560 | $9,910 | $22,650 |
| 2014 | $1,766 | $32,560 | $9,910 | $22,650 |
| 2013 | $1,956 | $35,670 | $9,910 | $25,760 |
Source: Public Records
Map
Nearby Homes
- 855 Hawthorne Dr
- 3963 Pharo Dr
- 4165 S Gensen Loop
- 4129 Forsythia Dr
- 3963 Benjamin St
- 4125 Beamer Ct
- 686 Loda Dr
- 685 Hillview Dr
- 4272 N Gensen Loop
- 4237 N Yorkshire Square
- 3927 Youngman Dr
- 4220 Forsythia Dr
- 985 Crestpoint Ct
- 738 Clough Pike
- 3921 Randolph Ln
- 4279 Larma Ln
- 671 Mccormick Ln
- 670 Mccormick Ln
- 4271 Wellington Dr
- 702 W Levitt Place
- 4072 Glen Este Withamsville Rd
- 4066 Glen Este Withamsville Rd
- 4076 Glen Este Withamsville Rd
- 4067 Glen Este Withamsville Rd
- 4063 Glen Este-Withamsville Rd
- 4063 Glen Este Withamsville Rd
- 4060 Glen Este Withamsville Rd
- 4082 Glen Este Withamsville Rd
- 853 Gorham Dr
- 4069 Glen Este Withamsville Rd
- 4064 Glen Este Withamsville Rd
- 852 Gorham Dr
- 4058 Glen Este Withamsville Rd
- 828 Loda Dr
- 4085 Glen Este Withamsville Rd
- 4085 Glen Este-Withamsville Rd
- 4077 Glen Este Withamsville Rd
- 0 Wagner Unit 1812025
- 0 Wagner Unit 1775840
- 15 Oaks Dr