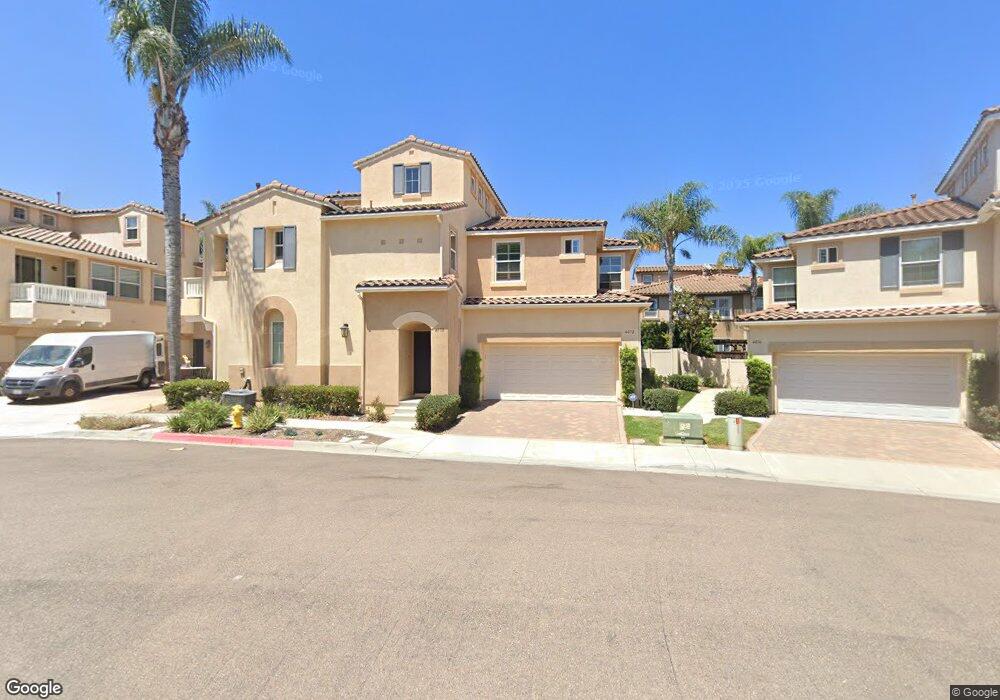
4072 Karst Rd Carlsbad, CA 92010
Calavera Hills NeighborhoodEstimated Value: $831,458 - $941,000
3
Beds
3
Baths
1,509
Sq Ft
$584/Sq Ft
Est. Value
About This Home
This home is located at 4072 Karst Rd, Carlsbad, CA 92010 and is currently estimated at $881,115, approximately $583 per square foot. 4072 Karst Rd is a home located in San Diego County with nearby schools including Calavera Hills Elementary, Calavera Hills Middle, and Sage Creek High.
Ownership History
Date
Name
Owned For
Owner Type
Purchase Details
Closed on
Aug 10, 2011
Sold by
Carney Devin Blair
Bought by
Ribnick Benjamin Perry
Current Estimated Value
Home Financials for this Owner
Home Financials are based on the most recent Mortgage that was taken out on this home.
Original Mortgage
$303,200
Outstanding Balance
$208,852
Interest Rate
4.46%
Mortgage Type
New Conventional
Estimated Equity
$672,263
Purchase Details
Closed on
Oct 19, 2006
Sold by
Cal E1 Llc
Bought by
Carney Devin Blair
Home Financials for this Owner
Home Financials are based on the most recent Mortgage that was taken out on this home.
Original Mortgage
$361,708
Interest Rate
6.33%
Mortgage Type
Purchase Money Mortgage
Create a Home Valuation Report for This Property
The Home Valuation Report is an in-depth analysis detailing your home's value as well as a comparison with similar homes in the area
Home Values in the Area
Average Home Value in this Area
Purchase History
| Date | Buyer | Sale Price | Title Company |
|---|---|---|---|
| Ribnick Benjamin Perry | $379,000 | Chicago Title | |
| Carney Devin Blair | -- | Chicago Title | |
| Carney Devin Blair | $452,500 | First American Title |
Source: Public Records
Mortgage History
| Date | Status | Borrower | Loan Amount |
|---|---|---|---|
| Open | Ribnick Benjamin Perry | $303,200 | |
| Previous Owner | Carney Devin Blair | $361,708 |
Source: Public Records
Tax History Compared to Growth
Tax History
| Year | Tax Paid | Tax Assessment Tax Assessment Total Assessment is a certain percentage of the fair market value that is determined by local assessors to be the total taxable value of land and additions on the property. | Land | Improvement |
|---|---|---|---|---|
| 2025 | $6,520 | $476,030 | $278,479 | $197,551 |
| 2024 | $6,520 | $466,697 | $273,019 | $193,678 |
| 2023 | $6,497 | $457,547 | $267,666 | $189,881 |
| 2022 | $6,418 | $448,576 | $262,418 | $186,158 |
| 2021 | $6,683 | $439,781 | $257,273 | $182,508 |
| 2020 | $6,643 | $435,272 | $254,635 | $180,637 |
| 2019 | $6,555 | $426,739 | $249,643 | $177,096 |
| 2018 | $6,441 | $418,373 | $244,749 | $173,624 |
| 2017 | $6,354 | $410,170 | $239,950 | $170,220 |
| 2016 | $6,183 | $402,129 | $235,246 | $166,883 |
| 2015 | $6,166 | $396,090 | $231,713 | $164,377 |
| 2014 | $6,091 | $388,333 | $227,175 | $161,158 |
Source: Public Records
Map
Nearby Homes
- 2992 Lexington Cir
- 4682 Meadow Dr
- 2835 Hillsboro Ct
- 2754 Inverness Dr
- 2935 Cliff Cir Unit 33
- 3019 Glenbrook St
- 4375 Stanford St
- 3618 Milford Place
- 3840 Stoneridge Rd
- 3545 Knollwood Dr
- 2755 Victoria Ave
- 4060 Alto St
- 2543 Glasgow Dr
- 4459 Dorchester Place
- 3304 Telaga Rd
- 3072 Marron Rd
- 4847 Nelson Ct
- 3438 Don Alberto Dr Unit 434
- 3466 Don Lorenzo Dr Unit 324
- 3445 Don Ortega Dr
- 4080 Karst Rd
- 4089 Karst Rd Unit 190
- 4101 Karst Rd
- 4097 Karst Rd
- 4103 Karst Rd
- 4087 Karst Rd
- 4091 Karst Rd Unit 192
- 4078 Karst Rd
- 4070 Karst Rd Unit 193
- 4095 Karst Rd
- 4086 Karst Rd
- 4068 Karst Rd
- 4076 Karst Rd
- 4084 Karst Rd
- 4099 Karst Rd Unit 185
- 4064 Karst Rd
- 4088 Karst Rd
- 4090 Karst Rd
- 4092 Karst Rd
- 4081 Peninsula Dr