Estimated Value: $688,368 - $764,000
4
Beds
2
Baths
1,621
Sq Ft
$443/Sq Ft
Est. Value
About This Home
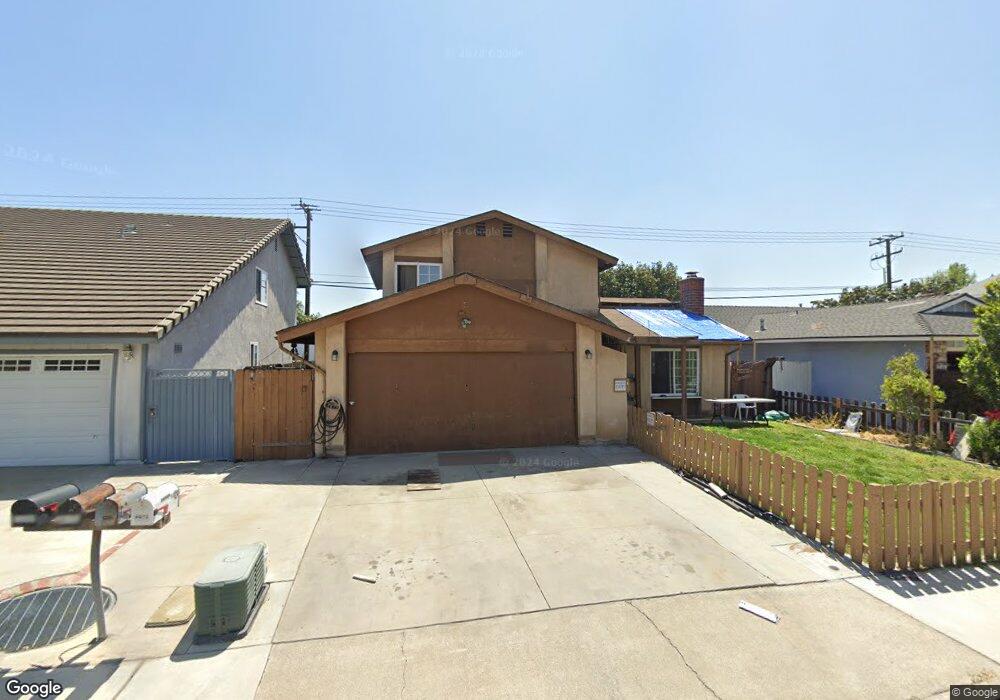
This home is located at 4075 Jose St, Chino, CA 91710 and is currently estimated at $718,842, approximately $443 per square foot. 4075 Jose St is a home located in San Bernardino County with nearby schools including Dickson Elementary, Ramona Junior High School, and Don Antonio Lugo High School.
Ownership History
Date
Name
Owned For
Owner Type
Purchase Details
Closed on
Feb 1, 1999
Sold by
Heron Ronald L and Heron Susan
Bought by
Espinoza Arthur
Current Estimated Value
Home Financials for this Owner
Home Financials are based on the most recent Mortgage that was taken out on this home.
Original Mortgage
$154,397
Interest Rate
6.91%
Mortgage Type
VA
Purchase Details
Closed on
May 20, 1994
Sold by
Heron Ronald Lee
Bought by
Heron Ronald Lee and Heron Susan
Create a Home Valuation Report for This Property
The Home Valuation Report is an in-depth analysis detailing your home's value as well as a comparison with similar homes in the area
Home Values in the Area
Average Home Value in this Area
Purchase History
| Date | Buyer | Sale Price | Title Company |
|---|---|---|---|
| Espinoza Arthur | $150,000 | Fidelity Title | |
| Heron Ronald Lee | -- | First American Title Ins Co |
Source: Public Records
Mortgage History
| Date | Status | Borrower | Loan Amount |
|---|---|---|---|
| Previous Owner | Espinoza Arthur | $154,397 |
Source: Public Records
Tax History
| Year | Tax Paid | Tax Assessment Tax Assessment Total Assessment is a certain percentage of the fair market value that is determined by local assessors to be the total taxable value of land and additions on the property. | Land | Improvement |
|---|---|---|---|---|
| 2025 | $2,559 | $235,006 | $82,253 | $152,753 |
| 2024 | $2,490 | $230,398 | $80,640 | $149,758 |
| 2023 | $2,420 | $225,881 | $79,059 | $146,822 |
| 2022 | $2,404 | $221,452 | $77,509 | $143,943 |
| 2021 | $2,356 | $217,110 | $75,989 | $141,121 |
| 2020 | $2,325 | $214,884 | $75,210 | $139,674 |
| 2019 | $2,283 | $210,670 | $73,735 | $136,935 |
| 2018 | $2,231 | $206,539 | $72,289 | $134,250 |
| 2017 | $2,190 | $202,490 | $70,872 | $131,618 |
| 2016 | $2,046 | $198,519 | $69,482 | $129,037 |
| 2015 | $2,004 | $195,537 | $68,438 | $127,099 |
| 2014 | $1,963 | $191,706 | $67,097 | $124,609 |
Source: Public Records
Map
Nearby Homes
- 4182 Denali Ln
- 4115 Bernardo Ct
- 0 Norton Ave
- 3927 Christina Rd
- 13144 Pipeline Ave
- 3508 Spur Ct
- 4621 Chino Ave
- 13148 Derby Ave
- 13140 Derby Ave
- 3260 Olympic View Dr
- 3248 Giant Forest Loop
- 4912 G St
- 13065 San Clemente Ln
- 3917 Yellowstone Cir
- 13257 2nd St
- 13239 2nd St
- 13650 3rd St
- 13079 Monte Vista Ave
- 12818 Mckinley Ave
- 13123 2nd St
- 4069 Jose St
- 4089 Jose St
- 4055 Jose St
- 4093 Jose St
- 13684 Tucker Ave
- 4047 Jose St
- 4060 Jose St
- 13689 Tucker Ave
- 13670 Tucker Ave
- 13683 Van Horn Cir E
- 13685 Tucker Ave
- 4033 Jose St
- 13679 Van Horn Cir E
- 13671 Tucker Ave
- 13668 Tucker Ave
- 13667 Van Horn Cir E
- 4021 Jose St
- 4055 Schaefer Ave
- 13669 Tucker Ave
- 13656 Tucker Ave
Your Personal Tour Guide
Ask me questions while you tour the home.