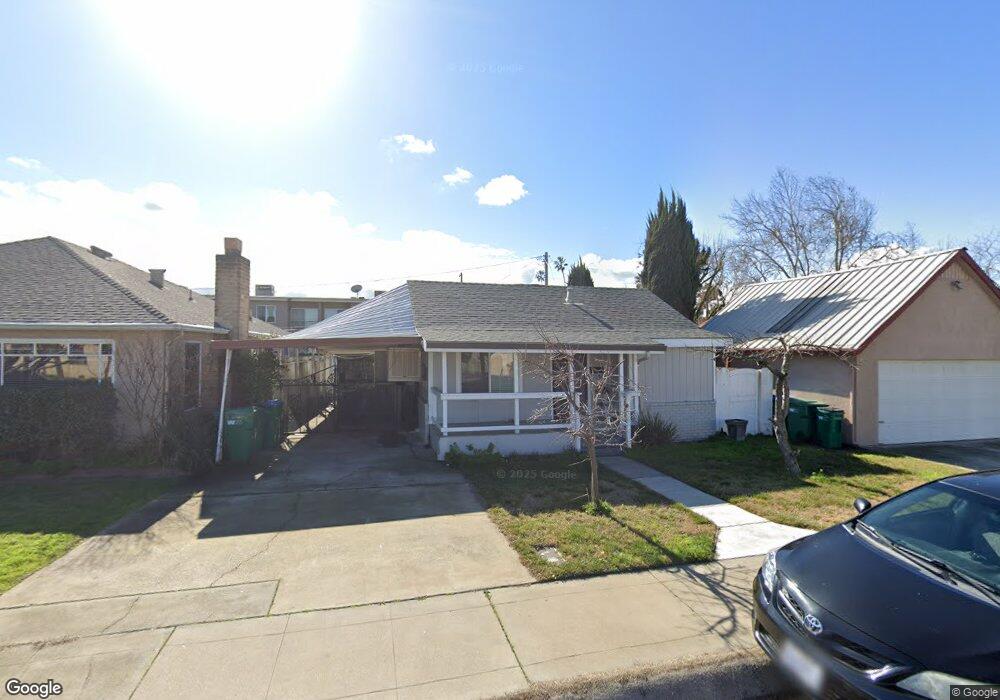
408 Concord St Lodi, CA 95240
East Lodi NeighborhoodEstimated Value: $242,000 - $437,000
3
Beds
2
Baths
1,015
Sq Ft
$339/Sq Ft
Est. Value
About This Home
This home is located at 408 Concord St, Lodi, CA 95240 and is currently estimated at $344,219, approximately $339 per square foot. 408 Concord St is a home located in San Joaquin County with nearby schools including Heritage Elementary School, Lodi Middle School, and Tokay High School.
Ownership History
Date
Name
Owned For
Owner Type
Purchase Details
Closed on
Feb 3, 2021
Sold by
Naseem Mohammad
Bought by
Khan Wajaht Ali
Current Estimated Value
Purchase Details
Closed on
Oct 19, 2012
Sold by
Khan Imran
Bought by
Naseem Mohammad
Purchase Details
Closed on
Jul 13, 2010
Sold by
Bibi Sughra
Bought by
Naseem Mohammad
Purchase Details
Closed on
Jul 29, 2009
Sold by
Khan Fozla
Bought by
Khan Imran
Purchase Details
Closed on
Jul 20, 2009
Sold by
U S Bank National Association
Bought by
Khan Imran
Purchase Details
Closed on
May 7, 2008
Sold by
Fernandez Jose Amparo
Bought by
U S Bank Na and Sasco 2007-Bc3
Purchase Details
Closed on
Apr 23, 2001
Sold by
Sublaban Faisal and Sublaban Helen
Bought by
Fernandez Jose Amparo
Purchase Details
Closed on
Dec 12, 1996
Sold by
Faisal Sublaban
Bought by
Sublaban Faisal E and Sublaban Helen L
Create a Home Valuation Report for This Property
The Home Valuation Report is an in-depth analysis detailing your home's value as well as a comparison with similar homes in the area
Home Values in the Area
Average Home Value in this Area
Purchase History
| Date | Buyer | Sale Price | Title Company |
|---|---|---|---|
| Khan Wajaht Ali | -- | None Available | |
| Naseem Mohammad | -- | None Available | |
| Naseem Mohammad | -- | None Available | |
| Khan Imran | -- | None Available | |
| Khan Imran | -- | North American Title Company | |
| Khan Imran | $50,500 | North American Title | |
| U S Bank Na | $131,250 | North American Title Co | |
| Fernandez Jose Amparo | $86,000 | -- | |
| Sublaban Faisal E | -- | -- |
Source: Public Records
Tax History
| Year | Tax Paid | Tax Assessment Tax Assessment Total Assessment is a certain percentage of the fair market value that is determined by local assessors to be the total taxable value of land and additions on the property. | Land | Improvement |
|---|---|---|---|---|
| 2025 | $3,160 | $297,667 | $92,006 | $205,661 |
| 2024 | $3,073 | $291,831 | $90,202 | $201,629 |
| 2023 | $974 | $88,763 | $35,505 | $53,258 |
| 2022 | $953 | $87,023 | $34,809 | $52,214 |
| 2021 | $970 | $85,318 | $34,127 | $51,191 |
| 2020 | $945 | $84,445 | $33,778 | $50,667 |
| 2019 | $927 | $82,790 | $33,116 | $49,674 |
| 2018 | $914 | $81,167 | $32,467 | $48,700 |
| 2017 | $894 | $79,577 | $31,831 | $47,746 |
| 2016 | $838 | $78,017 | $31,207 | $46,810 |
| 2014 | $820 | $75,340 | $30,136 | $45,204 |
Source: Public Records
Map
Nearby Homes
- 416 Concord St
- 1000 S Central Ave
- 325 Cypress St
- 320 Acacia St
- 834 S Washington St
- 312 Cherry St
- 333 Cherry St
- 433 Cherry St
- 20075 E Kettleman Ln
- 441 Elgin Ave
- 513 Harold St
- 471 Almond Dr Unit 22
- 471 Almond Dr Unit 89
- 471 Almond Dr Unit 40
- 471 Almond Dr Unit 69
- 445 Almond Dr Unit 93
- 445 Almond Dr Unit 108
- 445 Almond Dr Unit 37
- 445 Almond Dr Unit 106
- 1651 S Cherokee Ln Unit 4
- 414 Concord St
- 1028 S Central Ave
- 409 Concord St
- 403 Concord St
- 1014 1/2 S Central Ave
- 417 Concord St
- 1040 S Central Ave
- 420 Concord St
- 1014 S Central Ave
- 421 Concord St
- 413 Poplar St
- 1050 S Central Ave
- 415 Poplar St
- 1017 Wellswood Ct
- 1010 S Central Ave
- 426 Concord St
- 419 Poplar St
- 411 Poplar St
- 1027 S Central Ave
- 427 Concord St
Your Personal Tour Guide
Ask me questions while you tour the home.