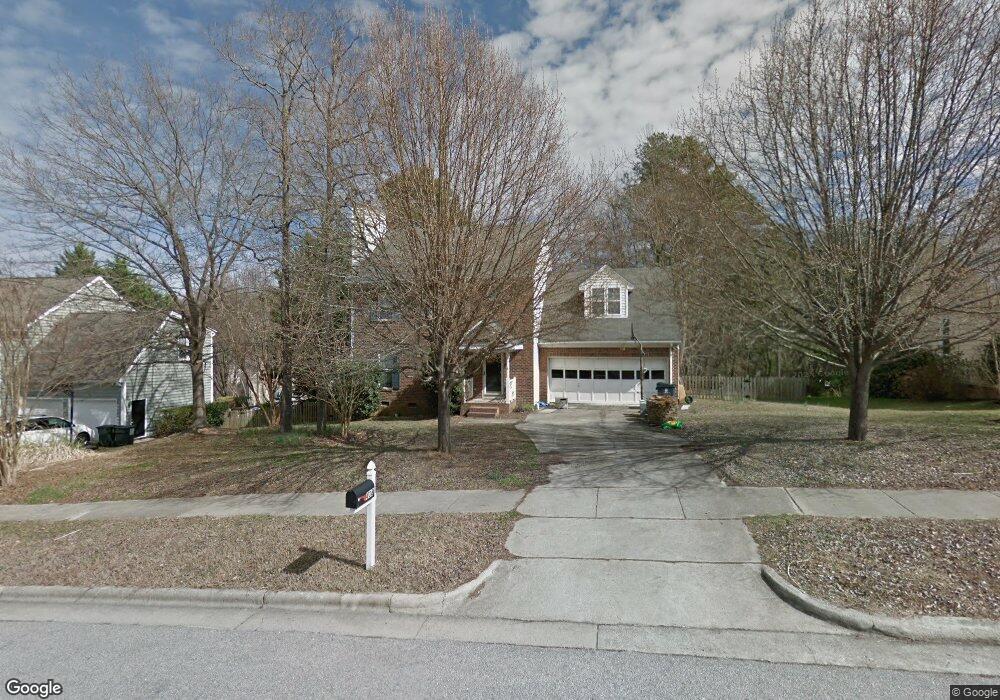
408 Gablefield Ln Apex, NC 27502
Beaver Creek NeighborhoodEstimated Value: $481,000 - $549,000
3
Beds
3
Baths
2,007
Sq Ft
$255/Sq Ft
Est. Value
About This Home
This home is located at 408 Gablefield Ln, Apex, NC 27502 and is currently estimated at $510,984, approximately $254 per square foot. 408 Gablefield Ln is a home located in Wake County with nearby schools including Baucom Elementary School, Apex Middle, and Apex High School.
Ownership History
Date
Name
Owned For
Owner Type
Purchase Details
Closed on
Sep 25, 2015
Sold by
Fraser Joann K
Bought by
Fraser Matthew O
Current Estimated Value
Home Financials for this Owner
Home Financials are based on the most recent Mortgage that was taken out on this home.
Original Mortgage
$163,850
Outstanding Balance
$128,916
Interest Rate
3.88%
Mortgage Type
New Conventional
Estimated Equity
$382,068
Purchase Details
Closed on
Jun 13, 2002
Sold by
Plowman Michael S and Plowman Elizabeth M
Bought by
Fraser Matthew O and Fraser Joann K
Home Financials for this Owner
Home Financials are based on the most recent Mortgage that was taken out on this home.
Original Mortgage
$158,000
Interest Rate
5.25%
Purchase Details
Closed on
May 28, 1999
Sold by
Hayne James H
Bought by
Plowman Michael S and Plowman Elizabeth M
Home Financials for this Owner
Home Financials are based on the most recent Mortgage that was taken out on this home.
Original Mortgage
$130,000
Interest Rate
6.84%
Create a Home Valuation Report for This Property
The Home Valuation Report is an in-depth analysis detailing your home's value as well as a comparison with similar homes in the area
Home Values in the Area
Average Home Value in this Area
Purchase History
| Date | Buyer | Sale Price | Title Company |
|---|---|---|---|
| Fraser Matthew O | -- | Attorney | |
| Fraser Matthew O | $197,500 | -- | |
| Plowman Michael S | $183,000 | -- |
Source: Public Records
Mortgage History
| Date | Status | Borrower | Loan Amount |
|---|---|---|---|
| Open | Fraser Matthew O | $163,850 | |
| Closed | Fraser Matthew O | $158,000 | |
| Previous Owner | Plowman Michael S | $130,000 | |
| Closed | Fraser Matthew O | $29,600 |
Source: Public Records
Tax History
| Year | Tax Paid | Tax Assessment Tax Assessment Total Assessment is a certain percentage of the fair market value that is determined by local assessors to be the total taxable value of land and additions on the property. | Land | Improvement |
|---|---|---|---|---|
| 2025 | $4,189 | $477,462 | $220,000 | $257,462 |
| 2024 | $4,095 | $477,462 | $220,000 | $257,462 |
Source: Public Records
Map
Nearby Homes
- 206 Hinton St
- 506 W Chatham St
- 104 Knightsborough Way
- 212 Hunter St
- 300 Pate St
- 907 Haddon Hall Dr
- 1209 Haywards Heath Ln
- 303 Cameron Glen Dr
- 406 S Salem St
- 307 S Elm St
- 309 Culvert St
- 547 Grand Central Station
- 311 Culvert St
- 427 Eyam Hall Ln
- 434 Eyam Hall Ln
- 610 Metro Station
- 1124 Platform Dr
- 105 Troyer Place
- 1115 Platform Dr
- 100 Henson Place
- 406 Gablefield Ln
- 410 Gablefield Ln
- 502 Windcrest Dr
- 102 Fair Spring Ct
- 404 Gablefield Ln
- 409 Gablefield Ln
- 407 Gablefield Ln
- 104 Fair Spring Ct
- 504 Windcrest Dr
- 411 Gablefield Ln
- 405 Gablefield Ln
- 501 Windcrest Dr
- 100 Fair Spring Ct
- 501 Gablefield Ln
- 402 Gablefield Ln
- 421 Fairview Rd
- 415 Fairview Rd
- 403 Gablefield Ln
- 505 Windcrest Dr
- 103 Fair Spring Ct
Your Personal Tour Guide
Ask me questions while you tour the home.