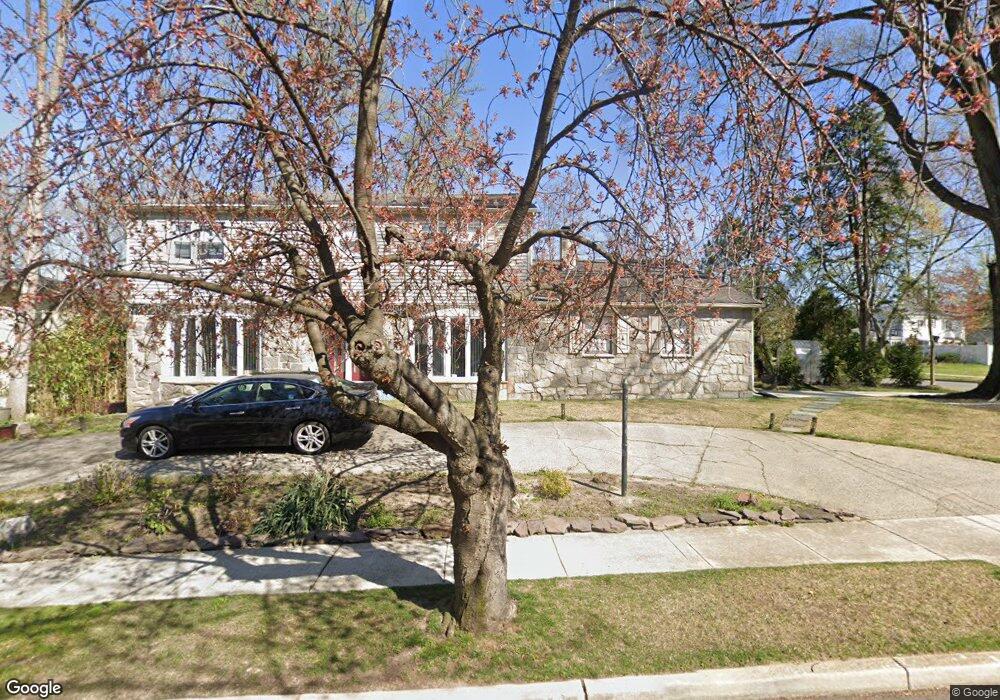
408 Hialeah Dr Cherry Hill, NJ 08002
Estimated Value: $616,000 - $697,000
4
Beds
4
Baths
3,440
Sq Ft
$189/Sq Ft
Est. Value
About This Home
This home is located at 408 Hialeah Dr, Cherry Hill, NJ 08002 and is currently estimated at $649,693, approximately $188 per square foot. 408 Hialeah Dr is a home located in Camden County with nearby schools including Joyce Kilmer Elementary School, John A Carusi Middle School, and Cherry Hill High-West High School.
Ownership History
Date
Name
Owned For
Owner Type
Purchase Details
Closed on
Sep 4, 2009
Sold by
Howard David
Bought by
Fields Clarence
Current Estimated Value
Home Financials for this Owner
Home Financials are based on the most recent Mortgage that was taken out on this home.
Original Mortgage
$309,294
Outstanding Balance
$203,200
Interest Rate
5.28%
Mortgage Type
FHA
Estimated Equity
$446,493
Purchase Details
Closed on
Dec 17, 2008
Sold by
David Heward Revocalbe Living Trust
Bought by
Heward David
Purchase Details
Closed on
Apr 28, 2008
Sold by
Heward David
Bought by
David Heward Family Living Tru
Purchase Details
Closed on
Dec 16, 2002
Sold by
Feenan Properties Llc
Bought by
Heward David
Purchase Details
Closed on
Nov 11, 1996
Sold by
Liebman Robert S
Bought by
Feenan Properties Llc
Create a Home Valuation Report for This Property
The Home Valuation Report is an in-depth analysis detailing your home's value as well as a comparison with similar homes in the area
Home Values in the Area
Average Home Value in this Area
Purchase History
| Date | Buyer | Sale Price | Title Company |
|---|---|---|---|
| Fields Clarence | $315,000 | -- | |
| Heward David | -- | -- | |
| David Heward Family Living Tru | -- | -- | |
| Heward David | -- | -- | |
| Feenan Properties Llc | $145,000 | -- |
Source: Public Records
Mortgage History
| Date | Status | Borrower | Loan Amount |
|---|---|---|---|
| Open | Fields Clarence | $309,294 |
Source: Public Records
Tax History
| Year | Tax Paid | Tax Assessment Tax Assessment Total Assessment is a certain percentage of the fair market value that is determined by local assessors to be the total taxable value of land and additions on the property. | Land | Improvement |
|---|---|---|---|---|
| 2025 | $12,857 | $273,500 | $62,200 | $211,300 |
| 2024 | $11,492 | $273,500 | $62,200 | $211,300 |
| 2023 | $11,492 | $273,500 | $62,200 | $211,300 |
| 2022 | $11,175 | $273,500 | $62,200 | $211,300 |
| 2021 | $11,211 | $273,500 | $62,200 | $211,300 |
| 2020 | $11,074 | $273,500 | $62,200 | $211,300 |
| 2019 | $11,069 | $273,500 | $62,200 | $211,300 |
| 2018 | $11,038 | $273,500 | $62,200 | $211,300 |
| 2017 | $10,888 | $273,500 | $62,200 | $211,300 |
| 2016 | $10,743 | $273,500 | $62,200 | $211,300 |
| 2015 | $10,574 | $273,500 | $62,200 | $211,300 |
| 2014 | $10,456 | $273,500 | $62,200 | $211,300 |
Source: Public Records
Map
Nearby Homes
- 313 Cherry Hill Blvd
- 306 Cherry Hill Blvd
- 1014 Bedford Ave
- 37 James Run
- 23 Appley Ct
- 25 Appley Ct
- 215 Chestnut St
- 18 Embassy Ct
- 4646 Derby Ct
- 748 Cooper Landing Rd
- 521 Woodland Ave
- 12 Katherine Ave
- 425 Yale Ave
- 4721 Champions Run
- 602 Woodland Ave
- 335 Connecticut Ave
- 406 Rhode Island Ave
- 903 Mercer St
- 904 Mercer St
- 2803 Chapel Ave W
- 417 Monmouth Dr
- 406 Hialeah Dr
- 413 Hialeah Dr
- 410 Hialeah Dr
- 415 Monmouth Dr
- 415 Hialeah Dr
- 404 Hialeah Dr
- 411 Hialeah Dr
- 448 Suffolk Dr
- 4 Santa Anita Place
- 417 Hialeah Dr
- 413 Monmouth Dr
- 402 Hialeah Dr
- 409 Hialeah Dr
- 412 Hialeah Dr
- 419 Hialeah Dr
- 400 Hialeah Dr
- 2 Santa Anita Place
- 411 Monmouth Dr
- 407 Hialeah Dr
Your Personal Tour Guide
Ask me questions while you tour the home.