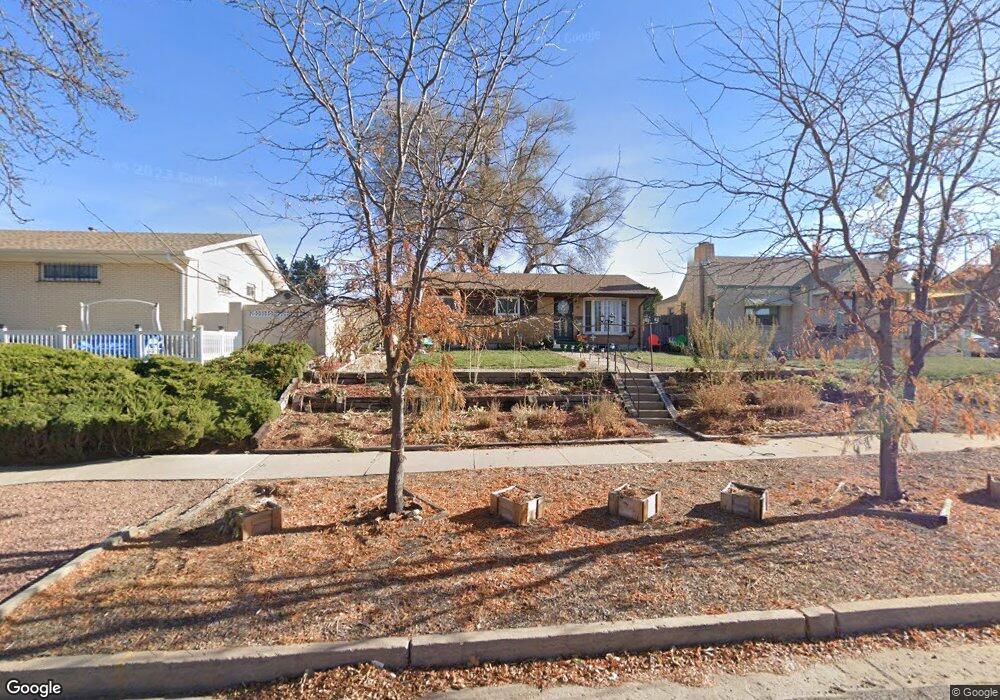
408 Jefferson St Pueblo, CO 81004
Mesa Junction NeighborhoodEstimated Value: $252,779 - $305,000
2
Beds
3
Baths
1,943
Sq Ft
$139/Sq Ft
Est. Value
About This Home
This home is located at 408 Jefferson St, Pueblo, CO 81004 and is currently estimated at $270,945, approximately $139 per square foot. 408 Jefferson St is a home located in Pueblo County with nearby schools including Bessemer Elementary School, Pueblo Academy of Arts, and Central High School.
Ownership History
Date
Name
Owned For
Owner Type
Purchase Details
Closed on
May 12, 2008
Sold by
Morgan Dahl and Morgan Susie
Bought by
Gaut Connie L
Current Estimated Value
Home Financials for this Owner
Home Financials are based on the most recent Mortgage that was taken out on this home.
Original Mortgage
$122,576
Outstanding Balance
$77,667
Interest Rate
5.89%
Mortgage Type
FHA
Estimated Equity
$193,278
Purchase Details
Closed on
May 8, 1987
Sold by
Trask Cristopher L
Bought by
Morgan Dahl + Susan
Purchase Details
Closed on
Aug 1, 1985
Sold by
Trask Cristopher L
Bought by
Same
Purchase Details
Closed on
Jul 19, 1985
Bought by
Trask Cristopher L
Purchase Details
Closed on
Nov 25, 1983
Sold by
Hobbs
Bought by
Hobbs E H + L M
Purchase Details
Closed on
Feb 10, 1978
Sold by
Hobbs Erskine H + Harriet E
Bought by
Hobbs Harriet E
Create a Home Valuation Report for This Property
The Home Valuation Report is an in-depth analysis detailing your home's value as well as a comparison with similar homes in the area
Home Values in the Area
Average Home Value in this Area
Purchase History
| Date | Buyer | Sale Price | Title Company |
|---|---|---|---|
| Gaut Connie L | $124,500 | Land Title Guarantee Company | |
| Morgan Dahl + Susan | $45,000 | -- | |
| Same | -- | -- | |
| Trask Cristopher L | $41,000 | -- | |
| Hobbs E H + L M | -- | -- | |
| Hobbs Harriet E | -- | -- |
Source: Public Records
Mortgage History
| Date | Status | Borrower | Loan Amount |
|---|---|---|---|
| Open | Gaut Connie L | $122,576 |
Source: Public Records
Tax History Compared to Growth
Tax History
| Year | Tax Paid | Tax Assessment Tax Assessment Total Assessment is a certain percentage of the fair market value that is determined by local assessors to be the total taxable value of land and additions on the property. | Land | Improvement |
|---|---|---|---|---|
| 2024 | $1,482 | $15,110 | -- | -- |
| 2023 | $1,498 | $18,800 | $1,010 | $17,790 |
| 2022 | $1,199 | $12,080 | $1,090 | $10,990 |
| 2021 | $1,239 | $12,440 | $1,130 | $11,310 |
| 2020 | $1,044 | $9,330 | $1,130 | $8,200 |
| 2019 | $1,044 | $10,344 | $644 | $9,700 |
| 2018 | $825 | $9,101 | $648 | $8,453 |
| 2017 | $833 | $9,101 | $648 | $8,453 |
| 2016 | $775 | $8,528 | $716 | $7,812 |
| 2015 | $772 | $8,528 | $716 | $7,812 |
| 2014 | $764 | $8,422 | $716 | $7,706 |
Source: Public Records
Map
Nearby Homes
- 611 E Pitkin Ave
- 935 Spruce St
- 937 Spruce St
- 522 Madison St
- 1003 E Orman Ave
- 1030 Pine St
- 418 E Orman Ave
- 938 E Evans Ave
- 841 E Abriendo Ave
- 1108 Cedar St
- 612 Lake Ave
- 315 E Routt Ave
- 316 E Orman Ave
- 1109 E Routt Ave
- 1027 E Abriendo Ave
- 1111 E Orman Ave
- 319 E Evans Ave
- 1129 Pine St
- 1012 E Abriendo Ave
- 317 E Evans Ave
- 412 Jefferson St
- 607 E Pitkin Ave
- 402 Jefferson St
- 416 Jefferson St
- 422 Jefferson St
- 405 Washington St
- 409 Washington St
- 401 Washington St
- 415 Washington St
- 426 Jefferson St
- 330 Jefferson St
- 409 Jefferson St
- 630 E Pitkin Ave
- 425 Washington St
- 430 Jefferson St
- 326 Jefferson St
- 427 Washington St
- 425 Jefferson St
- 419 Jefferson St
- 322 Jefferson St