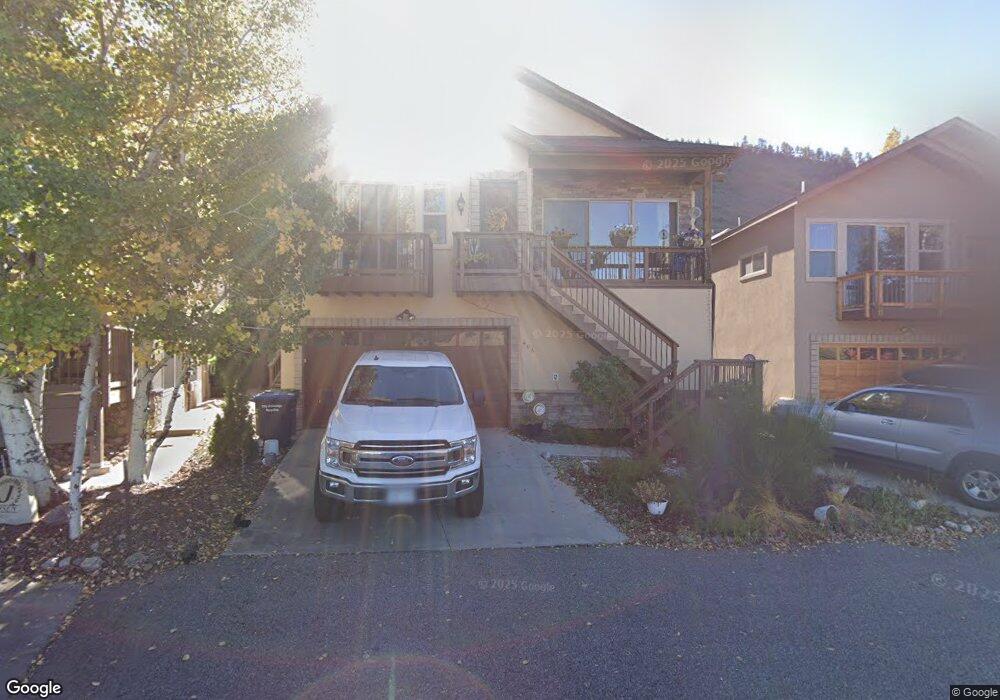
408 Jenkins Ranch Rd Durango, CO 81301
Skyridge NeighborhoodEstimated Value: $1,009,117 - $1,205,000
4
Beds
3
Baths
2,871
Sq Ft
$381/Sq Ft
Est. Value
About This Home
This home is located at 408 Jenkins Ranch Rd, Durango, CO 81301 and is currently estimated at $1,093,279, approximately $380 per square foot. 408 Jenkins Ranch Rd is a home located in La Plata County with nearby schools including Park Elementary School, Escalante Middle School, and Durango High School.
Ownership History
Date
Name
Owned For
Owner Type
Purchase Details
Closed on
Mar 2, 2015
Sold by
Davila Martin and Davila Martin J
Bought by
Lafrance Lucas and Lafrance Jennifer
Current Estimated Value
Home Financials for this Owner
Home Financials are based on the most recent Mortgage that was taken out on this home.
Original Mortgage
$391,200
Outstanding Balance
$299,620
Interest Rate
3.68%
Mortgage Type
New Conventional
Estimated Equity
$793,659
Purchase Details
Closed on
Nov 22, 2011
Sold by
Davila Kimberly B
Bought by
Davila Martin J
Purchase Details
Closed on
Jun 25, 2008
Sold by
Omega Investments Inc
Bought by
Davila Martin and Davila Kimberly
Home Financials for this Owner
Home Financials are based on the most recent Mortgage that was taken out on this home.
Original Mortgage
$420,000
Interest Rate
6.05%
Mortgage Type
Purchase Money Mortgage
Create a Home Valuation Report for This Property
The Home Valuation Report is an in-depth analysis detailing your home's value as well as a comparison with similar homes in the area
Home Values in the Area
Average Home Value in this Area
Purchase History
| Date | Buyer | Sale Price | Title Company |
|---|---|---|---|
| Lafrance Lucas | $489,000 | Land Title Guarantee Company | |
| Davila Martin J | -- | None Available | |
| Davila Martin | -- | Land Title |
Source: Public Records
Mortgage History
| Date | Status | Borrower | Loan Amount |
|---|---|---|---|
| Open | Lafrance Lucas | $391,200 | |
| Previous Owner | Davila Martin | $420,000 |
Source: Public Records
Tax History
| Year | Tax Paid | Tax Assessment Tax Assessment Total Assessment is a certain percentage of the fair market value that is determined by local assessors to be the total taxable value of land and additions on the property. | Land | Improvement |
|---|---|---|---|---|
| 2025 | $2,161 | $58,150 | $8,230 | $49,920 |
| 2024 | $1,838 | $45,730 | $7,560 | $38,170 |
| 2023 | $1,838 | $48,880 | $8,080 | $40,800 |
| 2022 | $1,670 | $51,270 | $8,480 | $42,790 |
| 2021 | $1,677 | $42,250 | $6,270 | $35,980 |
| 2020 | $1,629 | $42,360 | $6,210 | $36,150 |
| 2019 | $1,558 | $42,360 | $6,210 | $36,150 |
| 2018 | $1,463 | $40,280 | $5,880 | $34,400 |
| 2017 | $1,431 | $40,280 | $5,880 | $34,400 |
| 2016 | $1,342 | $41,170 | $5,730 | $35,440 |
| 2015 | $1,263 | $41,350 | $5,730 | $35,620 |
| 2014 | -- | $35,640 | $5,730 | $29,910 |
| 2013 | -- | $35,640 | $5,730 | $29,910 |
Source: Public Records
Map
Nearby Homes
- 311 Hillcrest Dr Unit 4
- 210 Jenkins Ranch Rd
- 105 Tierra Vista Dr
- 1100 Goeglein Gulch Rd Unit 155
- 1100 Goeglein Gulch Rd Unit 225
- 24 Sage Hill Ct
- 1200 Florida Rd Unit 7
- 570 Jenkins Ranch Rd
- 6 Ferringway Cir Unit 22
- 6 Ferringway Cir Unit 18
- 900 Florida Rd
- 149 Cedar Ridge Way
- TBD Cedar Ridge Way
- 170 Metz Ln
- 2718 New Mexico Ave Unit D
- 18 Miller Dr
- 25 Highland Place
- 349 Highland Hill Dr
- 180 Metz Ln Unit 1302
- 762 Goeglein Gulch Rd Unit 5
- 406 Jenkins Ranch Rd
- 410 Jenkins Ranch Rd
- 404 Jenkins Ranch Rd
- 41 Ophir Dr
- 350 Jenkins Ranch Rd
- 43 Ophir Dr
- 348 Jenkins Ranch Rd
- 45 Ophir Dr
- 412 Jenkins
- 412 Jenkins Ranch Rd
- 37 Ophir Dr
- 346 Jenkins Ranch Rd
- 47 Ophir Dr
- 414 Jenkins Ranch Rd
- 344 Jenkins Ranch Rd
- 375 Jenkins Ranch Rd
- 401 Jenkins Ranch Rd Unit 1
- 35 Ophir Dr
- 373 Jenkins Ranch Rd
- 403 Jenkins Ranch Rd Unit 2
Your Personal Tour Guide
Ask me questions while you tour the home.