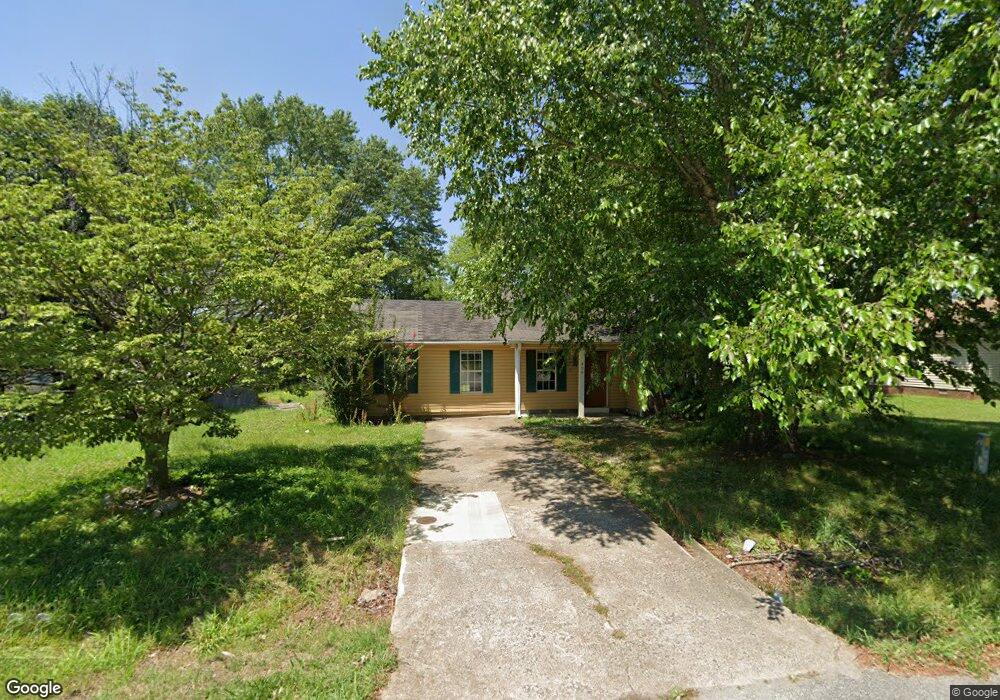
408 McGee Loop Jackson, TN 38305
Estimated Value: $145,651 - $196,000
Studio
1
Bath
1,116
Sq Ft
$157/Sq Ft
Est. Value
About This Home
This home is located at 408 McGee Loop, Jackson, TN 38305 and is currently estimated at $175,163, approximately $156 per square foot. 408 McGee Loop is a home located in Madison County with nearby schools including East Elementary School, Northeast Middle School, and North Side High School.
Ownership History
Date
Name
Owned For
Owner Type
Purchase Details
Closed on
Feb 22, 2022
Sold by
Merit Management Llc
Bought by
Sfr Jackson Llc
Current Estimated Value
Home Financials for this Owner
Home Financials are based on the most recent Mortgage that was taken out on this home.
Original Mortgage
$713,496
Outstanding Balance
$661,828
Interest Rate
3.92%
Mortgage Type
New Conventional
Estimated Equity
-$486,665
Purchase Details
Closed on
May 24, 2002
Sold by
Credit Suisse First Boston
Bought by
Merit Management
Home Financials for this Owner
Home Financials are based on the most recent Mortgage that was taken out on this home.
Original Mortgage
$58,000
Interest Rate
6.85%
Purchase Details
Closed on
Nov 8, 1995
Bought by
Robert Griffin
Purchase Details
Closed on
Aug 3, 1990
Bought by
Hays Steven D
Purchase Details
Closed on
Jan 31, 1989
Bought by
Trademark Homes Ltd
Purchase Details
Closed on
Apr 8, 1955
Bought by
Mcgee James C and Mcgee Mabel
Create a Home Valuation Report for This Property
The Home Valuation Report is an in-depth analysis detailing your home's value as well as a comparison with similar homes in the area
Purchase History
| Date | Buyer | Sale Price | Title Company |
|---|---|---|---|
| Sfr Jackson Llc | $692,000 | Wilkerson & Gauldin | |
| Merit Management | $54,100 | -- | |
| Credit Suisse First Boston | $54,100 | -- | |
| Robert Griffin | $54,000 | -- | |
| Hays Steven D | $43,000 | -- | |
| Trademark Homes Ltd | $3,000 | -- | |
| Mcgee James C | -- | -- |
Source: Public Records
Mortgage History
| Date | Status | Borrower | Loan Amount |
|---|---|---|---|
| Open | Sfr Jackson Llc | $713,496 | |
| Previous Owner | Mcgee James C | $58,000 |
Source: Public Records
Tax History
| Year | Tax Paid | Tax Assessment Tax Assessment Total Assessment is a certain percentage of the fair market value that is determined by local assessors to be the total taxable value of land and additions on the property. | Land | Improvement |
|---|---|---|---|---|
| 2025 | $512 | $27,325 | $5,000 | $22,325 |
| 2024 | $512 | $27,325 | $5,000 | $22,325 |
| 2022 | $512 | $27,325 | $5,000 | $22,325 |
| 2021 | $380 | $16,175 | $3,150 | $13,025 |
| 2020 | $380 | $16,175 | $3,150 | $13,025 |
| 2019 | $380 | $16,175 | $3,150 | $13,025 |
| 2018 | $380 | $16,175 | $3,150 | $13,025 |
| 2017 | $393 | $16,050 | $3,150 | $12,900 |
| 2016 | $345 | $16,050 | $3,150 | $12,900 |
| 2015 | $345 | $16,050 | $3,150 | $12,900 |
| 2014 | $339 | $15,750 | $3,150 | $12,600 |
Source: Public Records
Map
Nearby Homes
- 99 Hidden Valley Dr
- 91 McGee Loop
- 111 Henderson Rd
- 24 Palmetto Cove
- 0 Interstate 40 Unit 2505648
- 0 Interstate 40
- 0 U S Highway 412
- 0 Red Gum Ln & Old Medina Crossing Ln Unit 10195533
- 85 Old Medina Crossing
- 20 Bink Dr
- 00 Chloe Place
- 21 Bluebird Cove
- 41 International Cove
- 2888 Old Medina Rd
- 189 Valley Oak Loop
- 339 Parkstone Place
- 283 Parkstone Place
- 31 Mack St
- 130 Campbell Oaks Dr
- 62 Beth Place
- 175 Henderson Rd
- 400 McGee Loop
- 185 Henderson Rd
- 10 Lost Creek Dr
- 407 McGee Loop
- 415 McGee Loop
- 18 Lost Creek Dr
- 399 McGee Loop
- 391 McGee Loop
- 197 Henderson Rd
- 24 Lost Creek Dr
- 390 McGee Loop
- 11 Lost Creek Dr
- 19 Lost Creek Dr
- 389 McGee Loop
- 27 Lost Creek Dr
- 30 Lost Creek Dr
- 156 Henderson Rd
- 40 Weston Dr
- 378 McGee Loop
Your Personal Tour Guide
Ask me questions while you tour the home.