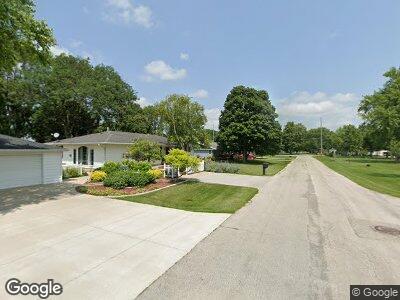
408 S Larch St Harcourt, IA 50544
Estimated Value: $108,000 - $228,000
2
Beds
3
Baths
1,394
Sq Ft
$127/Sq Ft
Est. Value
About This Home
This home is located at 408 S Larch St, Harcourt, IA 50544 and is currently estimated at $177,256, approximately $127 per square foot. 408 S Larch St is a home located in Webster County with nearby schools including Dayton Center and Southeast Webster-Grand Southeast Valley Middle School.
Ownership History
Date
Name
Owned For
Owner Type
Purchase Details
Closed on
Jun 4, 2024
Sold by
Blair Kelly L and Blair Rebecca G
Bought by
Kelly L Blair Revocable Trust and Rebecca G Blair Revocable Trust
Current Estimated Value
Purchase Details
Closed on
Aug 14, 2015
Sold by
Towers Michael J
Bought by
Blair Kelly L and Blair Rebecca
Purchase Details
Closed on
Apr 20, 2011
Sold by
Walley Perey M
Bought by
Blair Kelly L and Blair Rebecca G
Create a Home Valuation Report for This Property
The Home Valuation Report is an in-depth analysis detailing your home's value as well as a comparison with similar homes in the area
Home Values in the Area
Average Home Value in this Area
Purchase History
| Date | Buyer | Sale Price | Title Company |
|---|---|---|---|
| Kelly L Blair Revocable Trust | -- | None Listed On Document | |
| Blair Kelly L | -- | None Available | |
| Blair Kelly L | $50,000 | None Available |
Source: Public Records
Mortgage History
| Date | Status | Borrower | Loan Amount |
|---|---|---|---|
| Previous Owner | Blair Rebecca | $139,000 | |
| Closed | Blair Kelly L | $0 |
Source: Public Records
Tax History Compared to Growth
Tax History
| Year | Tax Paid | Tax Assessment Tax Assessment Total Assessment is a certain percentage of the fair market value that is determined by local assessors to be the total taxable value of land and additions on the property. | Land | Improvement |
|---|---|---|---|---|
| 2024 | $2,690 | $209,280 | $24,080 | $185,200 |
| 2023 | $1,769 | $202,600 | $17,400 | $185,200 |
| 2022 | $1,739 | $110,550 | $9,940 | $100,610 |
| 2021 | $1,660 | $110,550 | $9,940 | $100,610 |
| 2020 | $1,660 | $106,850 | $9,940 | $96,910 |
| 2019 | $1,462 | $104,220 | $10,930 | $93,290 |
| 2018 | $1,482 | $89,840 | $9,940 | $79,900 |
| 2017 | $1,482 | $73,880 | $0 | $0 |
| 2016 | $1,295 | $73,880 | $0 | $0 |
| 2015 | $1,290 | $73,880 | $0 | $0 |
| 2014 | $1,334 | $57,200 | $0 | $0 |
Source: Public Records
Map
Nearby Homes