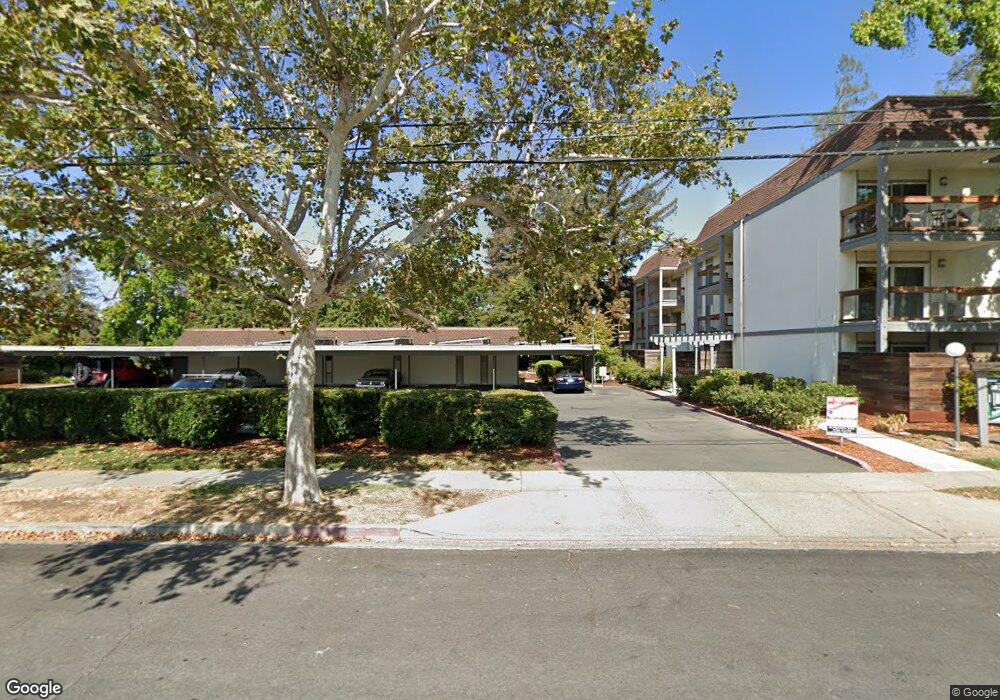
4081 Clayton Rd Unit 325 Concord, CA 94521
Crestwood NeighborhoodEstimated Value: $304,000 - $343,000
2
Beds
2
Baths
972
Sq Ft
$330/Sq Ft
Est. Value
About This Home
This home is located at 4081 Clayton Rd Unit 325, Concord, CA 94521 and is currently estimated at $320,508, approximately $329 per square foot. 4081 Clayton Rd Unit 325 is a home located in Contra Costa County with nearby schools including Westwood Elementary School, El Dorado Middle School, and Concord High School.
Ownership History
Date
Name
Owned For
Owner Type
Purchase Details
Closed on
Mar 28, 2017
Sold by
Parnagian Marlin F
Bought by
Parnagian Marlin F
Current Estimated Value
Purchase Details
Closed on
Jun 23, 2000
Sold by
Tchakedjian Caroline M
Bought by
Parnagian Korry M and Parnagion Korry M
Purchase Details
Closed on
May 5, 1998
Sold by
Washington Mutual Bank Fa
Bought by
Parnagion Korry M and Tchakedjian Caroline M
Purchase Details
Closed on
Jul 29, 1997
Sold by
Minnich Jr Jay F
Bought by
Great Western Bank Fsb
Purchase Details
Closed on
May 13, 1994
Sold by
Minnich Jay F and Minnich Takako
Bought by
Minnich Jr Jay F
Home Financials for this Owner
Home Financials are based on the most recent Mortgage that was taken out on this home.
Original Mortgage
$56,000
Interest Rate
8.1%
Mortgage Type
Purchase Money Mortgage
Create a Home Valuation Report for This Property
The Home Valuation Report is an in-depth analysis detailing your home's value as well as a comparison with similar homes in the area
Home Values in the Area
Average Home Value in this Area
Purchase History
| Date | Buyer | Sale Price | Title Company |
|---|---|---|---|
| Parnagian Marlin F | -- | None Available | |
| Parnagian Korry M | -- | -- | |
| Parnagion Korry M | $58,000 | Chicago Title Co | |
| Great Western Bank Fsb | $41,245 | Chicago Title Co | |
| Minnich Jr Jay F | $70,000 | Old Republic Title Company |
Source: Public Records
Mortgage History
| Date | Status | Borrower | Loan Amount |
|---|---|---|---|
| Previous Owner | Minnich Jr Jay F | $56,000 |
Source: Public Records
Tax History Compared to Growth
Tax History
| Year | Tax Paid | Tax Assessment Tax Assessment Total Assessment is a certain percentage of the fair market value that is determined by local assessors to be the total taxable value of land and additions on the property. | Land | Improvement |
|---|---|---|---|---|
| 2025 | $1,959 | $107,759 | $47,608 | $60,151 |
| 2024 | $1,896 | $105,647 | $46,675 | $58,972 |
| 2023 | $1,896 | $103,576 | $45,760 | $57,816 |
| 2022 | $1,842 | $101,546 | $44,863 | $56,683 |
| 2021 | $1,774 | $99,556 | $43,984 | $55,572 |
| 2019 | $1,720 | $96,605 | $42,680 | $53,925 |
| 2018 | $1,637 | $94,712 | $41,844 | $52,868 |
| 2017 | $1,562 | $92,856 | $41,024 | $51,832 |
| 2016 | $1,551 | $91,036 | $40,220 | $50,816 |
| 2015 | $1,496 | $89,669 | $39,616 | $50,053 |
| 2014 | $1,436 | $87,913 | $38,840 | $49,073 |
Source: Public Records
Map
Nearby Homes
- 4081 Clayton Rd Unit 201
- 4081 Clayton Rd Unit 117
- 1467 Cape Cod Way
- 4004 Salem St
- 4020 Salem St
- 1579 West St
- 3905 Clayton Rd Unit 37
- 1381 Rosal Ln
- 3901 Clayton Rd Unit 57
- 1337 Cape Cod Way
- 4045 Sacramento St
- 1662 Dorchester Place
- 4204 Dubhe Ct
- 1567 Glazier Dr
- 1435 Bel Air Dr Unit C
- 1450 Bel Air Dr Unit 110
- 1693 Greentree Dr
- 3641 Clayton Rd Unit 34
- 3810 Lornell Ct
- 4023 Roland Dr
- 4081 Clayton Rd
- 4081 Clayton Rd Unit 222
- 4081 Clayton Rd
- 4081 Clayton Rd Unit 330
- 4081 Clayton Rd Unit 230
- 4081 Clayton Rd Unit 130
- 4081 Clayton Rd Unit 229
- 4081 Clayton Rd Unit 129
- 4081 Clayton Rd Unit 228
- 4081 Clayton Rd Unit 128
- 4081 Clayton Rd Unit 327
- 4081 Clayton Rd Unit 227
- 4081 Clayton Rd Unit 127
- 4081 Clayton Rd Unit 326
- 4081 Clayton Rd Unit 226
- 4081 Clayton Rd Unit 126
- 4081 Clayton Rd Unit 340
- 4081 Clayton Rd Unit 240
- 4081 Clayton Rd Unit 140
- 4081 Clayton Rd Unit 339