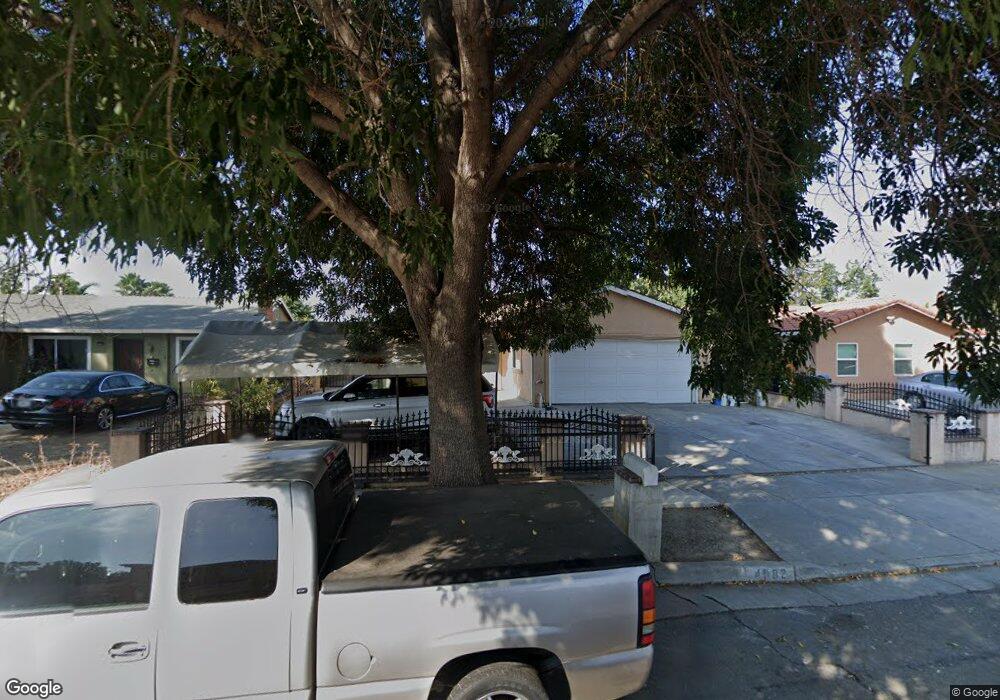
4083 Forestbrook Way San Jose, CA 95111
Hellyer NeighborhoodEstimated Value: $979,623 - $1,126,000
3
Beds
2
Baths
1,007
Sq Ft
$1,033/Sq Ft
Est. Value
About This Home
This home is located at 4083 Forestbrook Way, San Jose, CA 95111 and is currently estimated at $1,040,656, approximately $1,033 per square foot. 4083 Forestbrook Way is a home located in Santa Clara County with nearby schools including G.W. Hellyer Elementary School, Sylvandale Middle School, and Andrew P. Hill High School.
Ownership History
Date
Name
Owned For
Owner Type
Purchase Details
Closed on
Oct 5, 2021
Sold by
Xiong Chengyu and Deng Xianmin
Bought by
Xiong Chengyu and Deng Xianmin
Current Estimated Value
Home Financials for this Owner
Home Financials are based on the most recent Mortgage that was taken out on this home.
Original Mortgage
$190,000
Outstanding Balance
$173,262
Interest Rate
2.8%
Mortgage Type
New Conventional
Estimated Equity
$867,394
Purchase Details
Closed on
Dec 19, 2020
Sold by
Xiong Chengyu and Deng Xianmin
Bought by
Xiong Chengyu and Deng Xianmin
Purchase Details
Closed on
Oct 27, 2011
Sold by
Flores Abelardo and Flores Maria Del Carmen
Bought by
Xiong Chengyu and Deng Xianhmin
Home Financials for this Owner
Home Financials are based on the most recent Mortgage that was taken out on this home.
Original Mortgage
$200,000
Interest Rate
4.01%
Mortgage Type
New Conventional
Purchase Details
Closed on
May 18, 2005
Sold by
Flores Abelardo and Flores Maria
Bought by
Flores Abelardo and Flores Maria Del Carmen
Home Financials for this Owner
Home Financials are based on the most recent Mortgage that was taken out on this home.
Original Mortgage
$505,750
Interest Rate
8.85%
Mortgage Type
New Conventional
Purchase Details
Closed on
Oct 8, 2002
Sold by
Flores Abelardo and Flores Maria Delcarmen
Bought by
Flores Abelardo and Flores Maria
Home Financials for this Owner
Home Financials are based on the most recent Mortgage that was taken out on this home.
Original Mortgage
$361,250
Interest Rate
8.25%
Purchase Details
Closed on
Jul 6, 2001
Sold by
Rios Jose Luis
Bought by
Flores Abelardo and Flores Maria Delcarmen
Home Financials for this Owner
Home Financials are based on the most recent Mortgage that was taken out on this home.
Original Mortgage
$285,000
Interest Rate
8.99%
Purchase Details
Closed on
Jan 26, 2000
Sold by
Abelardo Flores and Abelardo Maria D
Bought by
Flores Abelardo and Flores Maria Delcarmen
Home Financials for this Owner
Home Financials are based on the most recent Mortgage that was taken out on this home.
Original Mortgage
$190,000
Interest Rate
7.96%
Create a Home Valuation Report for This Property
The Home Valuation Report is an in-depth analysis detailing your home's value as well as a comparison with similar homes in the area
Home Values in the Area
Average Home Value in this Area
Purchase History
| Date | Buyer | Sale Price | Title Company |
|---|---|---|---|
| Xiong Chengyu | -- | Fidelity National Title Co | |
| Xiong Chengyu | -- | Fidelity National Title Co | |
| Xiong Chengyu | -- | None Available | |
| Xiong Chengyu | $275,000 | Fidelity National Title Co | |
| Flores Abelardo | -- | Fidelity National Title Ins | |
| Flores Abelardo | -- | Fidelity National Title Ins | |
| Flores Abelardo | -- | Commonwealth Land Title Co | |
| Flores Abelardo | $63,500 | Alliance Title Company | |
| Rios Jose Luis | -- | Alliance Title Company |
Source: Public Records
Mortgage History
| Date | Status | Borrower | Loan Amount |
|---|---|---|---|
| Open | Xiong Chengyu | $190,000 | |
| Closed | Xiong Chengyu | $200,000 | |
| Previous Owner | Flores Abelardo | $505,750 | |
| Previous Owner | Flores Abelardo | $361,250 | |
| Previous Owner | Flores Abelardo | $285,000 | |
| Previous Owner | Flores Abelardo | $190,000 |
Source: Public Records
Tax History Compared to Growth
Tax History
| Year | Tax Paid | Tax Assessment Tax Assessment Total Assessment is a certain percentage of the fair market value that is determined by local assessors to be the total taxable value of land and additions on the property. | Land | Improvement |
|---|---|---|---|---|
| 2025 | $5,959 | $345,089 | $206,993 | $138,096 |
| 2024 | $5,959 | $338,324 | $202,935 | $135,389 |
| 2023 | $5,858 | $331,691 | $198,956 | $132,735 |
| 2022 | $5,736 | $325,188 | $195,055 | $130,133 |
| 2021 | $5,672 | $318,813 | $191,231 | $127,582 |
| 2020 | $5,439 | $315,545 | $189,271 | $126,274 |
| 2019 | $5,217 | $309,359 | $185,560 | $123,799 |
| 2018 | $5,197 | $303,294 | $181,922 | $121,372 |
| 2017 | $5,125 | $297,348 | $178,355 | $118,993 |
| 2016 | $4,875 | $291,518 | $174,858 | $116,660 |
| 2015 | $4,775 | $287,140 | $172,232 | $114,908 |
| 2014 | $4,323 | $281,517 | $168,859 | $112,658 |
Source: Public Records
Map
Nearby Homes
- 4219 Senter Rd
- 471 Serenade Way
- 4171 Ambler Way
- 403 Mignot Ln
- 204 Santa Rosa Dr
- 4573 Bolero Dr
- 640 Coyote Rd
- 573 Bamboo Ct
- 491 Ginkgo Ct
- 3461 Senter Rd
- 4320 Monterey Rd Unit 39
- 3262 Sagittarius Ln
- 3814 Seven Trees Blvd
- 572 Groth Dr
- 3128 Shofner Place
- 3891 Marfrance Dr
- 96 Rancho Dr Unit B
- 523 Sieber Place
- 3843 Marfrance Dr
- 4614 Houndshaven Way
- 4075 Forestbrook Way
- 4087 Forestbrook Way
- 595 Rudd Ct
- 4071 Forestbrook Way
- 587 Rudd Ct
- 4097 Forestbrook Way
- 594 Rudd Ct
- 531 Nokomis Dr
- 4082 Forestbrook Way
- 4088 Forestbrook Way
- 4074 Forestbrook Way
- 4094 Forestbrook Way
- 4049 Forestbrook Way
- 579 Rudd Ct
- 4045 Forestbrook Way
- 521 Nokomis Dr
- 586 Rudd Ct
- 4070 Forestbrook Way
- 4039 Forestbrook Way
- 511 Nokomis Dr