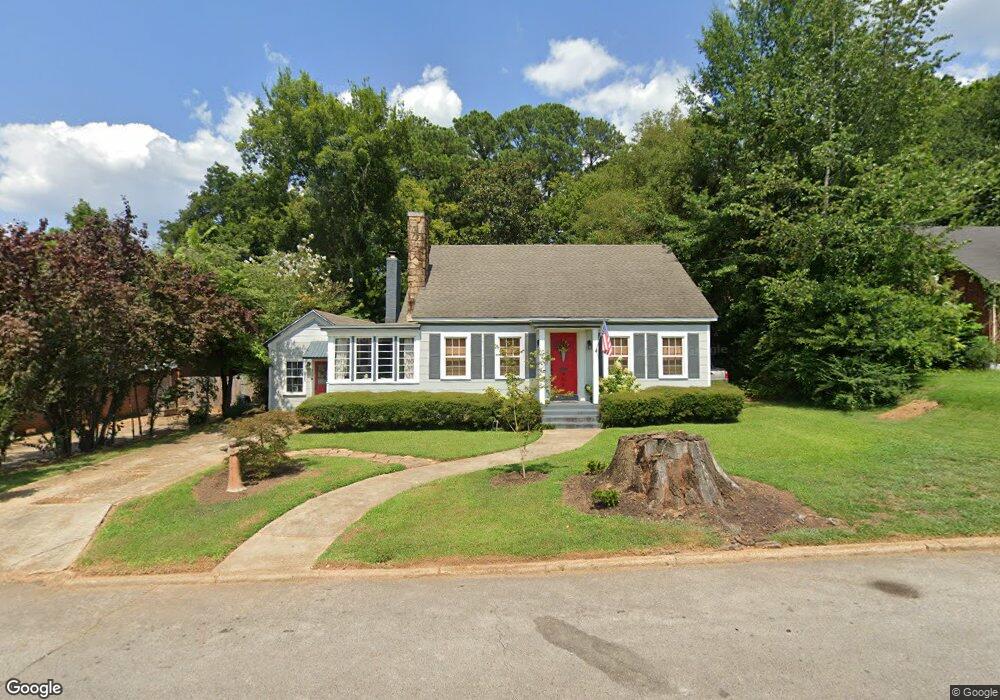
409 Apple St New Albany, MS 38652
Estimated Value: $144,454 - $235,000
Studio
2
Baths
1,760
Sq Ft
$113/Sq Ft
Est. Value
About This Home
This home is located at 409 Apple St, New Albany, MS 38652 and is currently estimated at $199,614, approximately $113 per square foot. 409 Apple St is a home located in Union County with nearby schools including New Albany Elementary School, New Albany/S.Tippah/Union County Alternative School, and New Albany Middle School.
Ownership History
Date
Name
Owned For
Owner Type
Purchase Details
Closed on
Sep 9, 2020
Sold by
Hines William Lamar and Hines Teresa Evelyn
Bought by
Ford Jerry Robert and Ford Beverly Brown
Current Estimated Value
Purchase Details
Closed on
Jul 1, 2015
Sold by
Not Provided
Bought by
Not Provided
Purchase Details
Closed on
Feb 24, 2006
Sold by
Deguzman Roman
Bought by
Hale Racco Michelle and Prather Amery Terrill
Create a Home Valuation Report for This Property
The Home Valuation Report is an in-depth analysis detailing your home's value as well as a comparison with similar homes in the area
Home Values in the Area
Average Home Value in this Area
Purchase History
| Date | Buyer | Sale Price | Title Company |
|---|---|---|---|
| Ford Jerry Robert | -- | None Available | |
| Not Provided | -- | -- | |
| Hale Racco Michelle | -- | -- |
Source: Public Records
Tax History
| Year | Tax Paid | Tax Assessment Tax Assessment Total Assessment is a certain percentage of the fair market value that is determined by local assessors to be the total taxable value of land and additions on the property. | Land | Improvement |
|---|---|---|---|---|
| 2025 | -- | $6,783 | $0 | $0 |
| 2024 | -- | $6,783 | $0 | $0 |
| 2023 | -- | $6,783 | $0 | $0 |
| 2022 | $0 | $5,507 | $0 | $0 |
| 2021 | $0 | $5,507 | $0 | $0 |
| 2020 | $1,157 | $8,261 | $0 | $0 |
| 2019 | $1,156 | $8,252 | $0 | $0 |
| 2018 | $1,093 | $7,799 | $0 | $0 |
| 2017 | $1,062 | $7,799 | $0 | $0 |
| 2016 | $1,027 | $7,799 | $0 | $0 |
| 2015 | -- | $7,553 | $0 | $0 |
| 2014 | -- | $7,613 | $0 | $0 |
Source: Public Records
Map
Nearby Homes
Your Personal Tour Guide
Ask me questions while you tour the home.