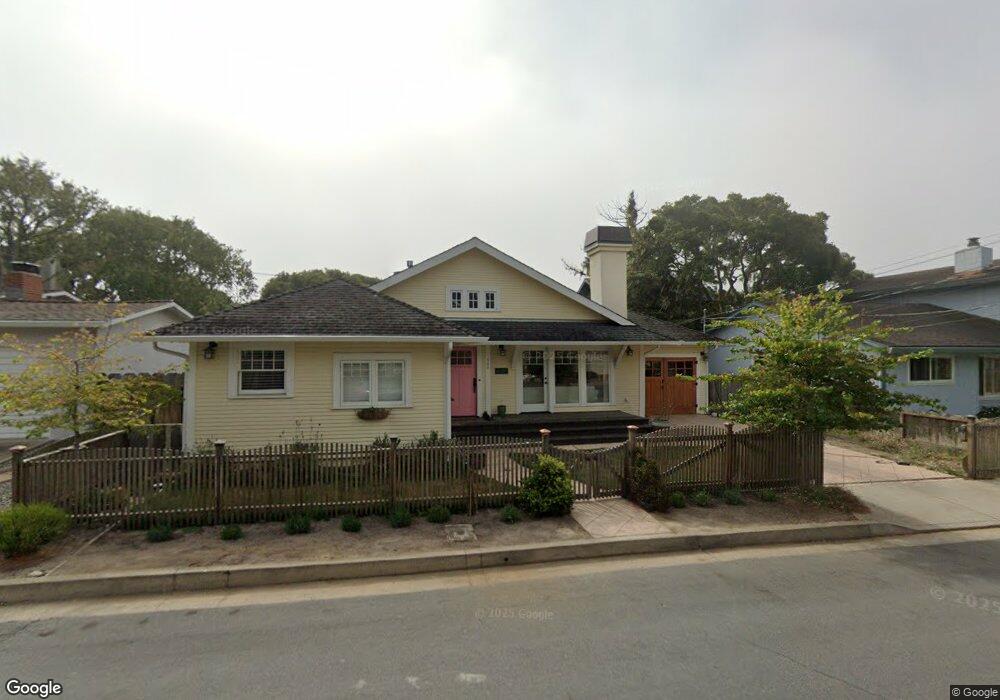
409 Chestnut St Pacific Grove, CA 93950
Estimated Value: $1,303,599 - $2,756,000
3
Beds
2
Baths
1,386
Sq Ft
$1,287/Sq Ft
Est. Value
About This Home
This home is located at 409 Chestnut St, Pacific Grove, CA 93950 and is currently estimated at $1,783,150, approximately $1,286 per square foot. 409 Chestnut St is a home located in Monterey County with nearby schools including Robert Down Elementary School, Pacific Grove Middle School, and Pacific Grove High School.
Ownership History
Date
Name
Owned For
Owner Type
Purchase Details
Closed on
Oct 10, 1997
Sold by
Dipalma Alyce and Cathey Alyce Berthe Beatrix
Bought by
White Robert E and White Sherri G
Current Estimated Value
Home Financials for this Owner
Home Financials are based on the most recent Mortgage that was taken out on this home.
Original Mortgage
$166,500
Outstanding Balance
$26,844
Interest Rate
7.49%
Estimated Equity
$1,756,306
Create a Home Valuation Report for This Property
The Home Valuation Report is an in-depth analysis detailing your home's value as well as a comparison with similar homes in the area
Home Values in the Area
Average Home Value in this Area
Purchase History
| Date | Buyer | Sale Price | Title Company |
|---|---|---|---|
| White Robert E | -- | Stewart Title |
Source: Public Records
Mortgage History
| Date | Status | Borrower | Loan Amount |
|---|---|---|---|
| Open | White Robert E | $166,500 |
Source: Public Records
Tax History Compared to Growth
Tax History
| Year | Tax Paid | Tax Assessment Tax Assessment Total Assessment is a certain percentage of the fair market value that is determined by local assessors to be the total taxable value of land and additions on the property. | Land | Improvement |
|---|---|---|---|---|
| 2025 | $5,488 | $529,521 | $255,461 | $274,060 |
| 2024 | $5,488 | $519,139 | $250,452 | $268,687 |
| 2023 | $5,610 | $508,961 | $245,542 | $263,419 |
| 2022 | $5,496 | $498,982 | $240,728 | $258,254 |
| 2021 | $5,466 | $489,199 | $236,008 | $253,191 |
| 2020 | $5,357 | $484,184 | $233,589 | $250,595 |
| 2019 | $5,187 | $474,691 | $229,009 | $245,682 |
| 2018 | $5,084 | $465,384 | $224,519 | $240,865 |
| 2017 | $5,001 | $456,260 | $220,117 | $236,143 |
| 2016 | $5,011 | $447,314 | $215,801 | $231,513 |
| 2015 | $4,930 | $440,596 | $212,560 | $228,036 |
| 2014 | $4,827 | $431,967 | $208,397 | $223,570 |
Source: Public Records
Map
Nearby Homes
- 311 Walnut St
- 791 Spruce Ave
- 311 Lobos Ave
- 765 Gibson Ave
- 222 Wood St
- 309 Congress Ave
- 302 Park St
- 206 Cypress Ave Unit B
- 820 - 822 Cedar St
- 304 Grove Acre Ave
- 700 Rosemont Ave
- 735 Bayview Ave
- 224 16th St
- 618 Forest Ave
- 127 16th St
- 132 Forest Ave
- 775 Mermaid Ave
- 520 Lighthouse Ave Unit 301
- 813 Ocean View Blvd
- 585 Ocean View Blvd Unit 3