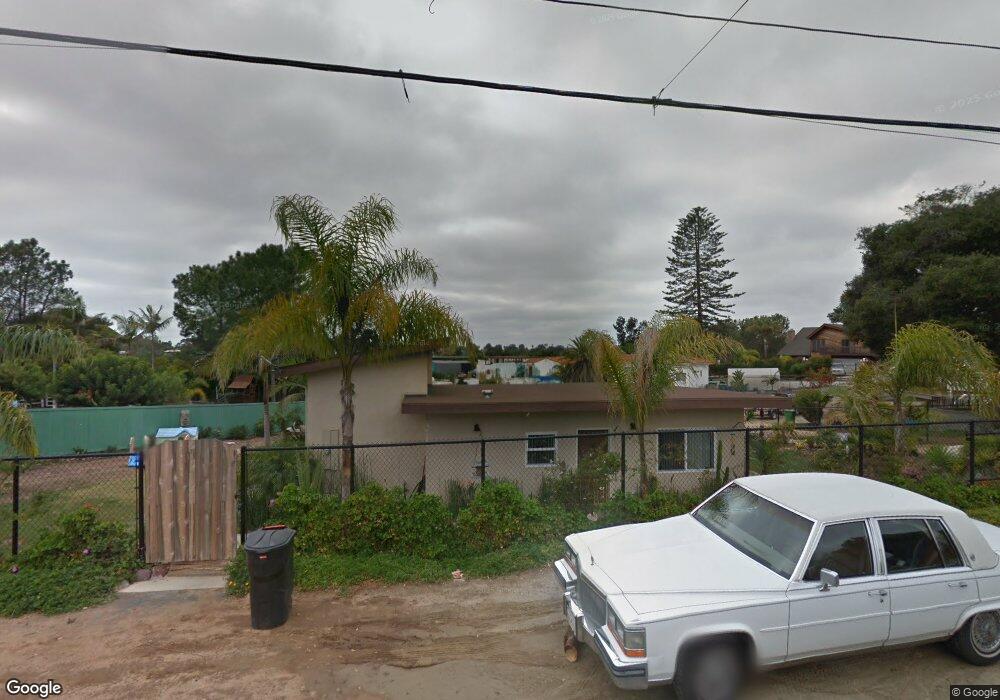
409 Crouch St Oceanside, CA 92054
Loma Alta NeighborhoodEstimated Value: $759,000 - $977,000
2
Beds
1
Bath
1,016
Sq Ft
$842/Sq Ft
Est. Value
About This Home
This home is located at 409 Crouch St, Oceanside, CA 92054 and is currently estimated at $855,219, approximately $841 per square foot. 409 Crouch St is a home located in San Diego County with nearby schools including Mission Elementary School, Lincoln Middle School, and Oceanside High School.
Ownership History
Date
Name
Owned For
Owner Type
Purchase Details
Closed on
Mar 27, 2019
Sold by
Doherty Charles W
Bought by
Doherty Charles W and Doherty March 27 201 Charles W
Current Estimated Value
Purchase Details
Closed on
Mar 10, 2005
Sold by
Walwick Maureen R
Bought by
Doherty Charles W
Home Financials for this Owner
Home Financials are based on the most recent Mortgage that was taken out on this home.
Original Mortgage
$276,000
Outstanding Balance
$132,075
Interest Rate
4.77%
Mortgage Type
Negative Amortization
Estimated Equity
$723,144
Purchase Details
Closed on
May 21, 2003
Sold by
Cooper Glenn and Cooper Margaret
Bought by
First Security Exchange Corp
Purchase Details
Closed on
Aug 17, 1994
Sold by
James Cherylyn
Bought by
James William P
Create a Home Valuation Report for This Property
The Home Valuation Report is an in-depth analysis detailing your home's value as well as a comparison with similar homes in the area
Home Values in the Area
Average Home Value in this Area
Purchase History
| Date | Buyer | Sale Price | Title Company |
|---|---|---|---|
| Doherty Charles W | -- | None Available | |
| Doherty Charles W | $395,000 | First American Title | |
| First Security Exchange Corp | $328,000 | Chicago Title Co | |
| James William P | -- | Union Land Title Company |
Source: Public Records
Mortgage History
| Date | Status | Borrower | Loan Amount |
|---|---|---|---|
| Open | Doherty Charles W | $276,000 |
Source: Public Records
Tax History
| Year | Tax Paid | Tax Assessment Tax Assessment Total Assessment is a certain percentage of the fair market value that is determined by local assessors to be the total taxable value of land and additions on the property. | Land | Improvement |
|---|---|---|---|---|
| 2025 | $6,242 | $564,777 | $515,739 | $49,038 |
| 2024 | $6,242 | $553,704 | $505,627 | $48,077 |
| 2023 | $6,050 | $542,848 | $495,713 | $47,135 |
| 2022 | $5,959 | $532,205 | $485,994 | $46,211 |
| 2021 | $5,507 | $480,000 | $333,000 | $147,000 |
| 2020 | $4,891 | $435,000 | $302,000 | $133,000 |
| 2019 | $4,733 | $425,000 | $296,000 | $129,000 |
| 2018 | $4,776 | $425,000 | $296,000 | $129,000 |
| 2017 | $5,004 | $445,000 | $310,000 | $135,000 |
| 2016 | $3,949 | $355,000 | $222,000 | $133,000 |
| 2015 | $3,567 | $325,000 | $204,000 | $121,000 |
| 2014 | $3,232 | $300,000 | $189,000 | $111,000 |
Source: Public Records
Map
Nearby Homes
- 2721 Lomita St
- 506 Canyon Dr Unit 6
- 506 Canyon Dr Unit 85
- 2821 Macdonald St
- 230 Hoover St
- 2245 Hilldale St
- 116 N Barnwell St
- 519 Camelot Dr
- 1786 Jasmine Way
- 2713 Lancelot Dr
- 2306 Loker Way
- 2308 Loker Way
- 2312 Loker Way
- 2309 Loker Way
- 1535 Molly Cir
- 2311 Loker Way
- 223 Cottingham Ct
- 1331 Cornish Dr
- 2241 California St
- 503 505 N Nevada St
Your Personal Tour Guide
Ask me questions while you tour the home.