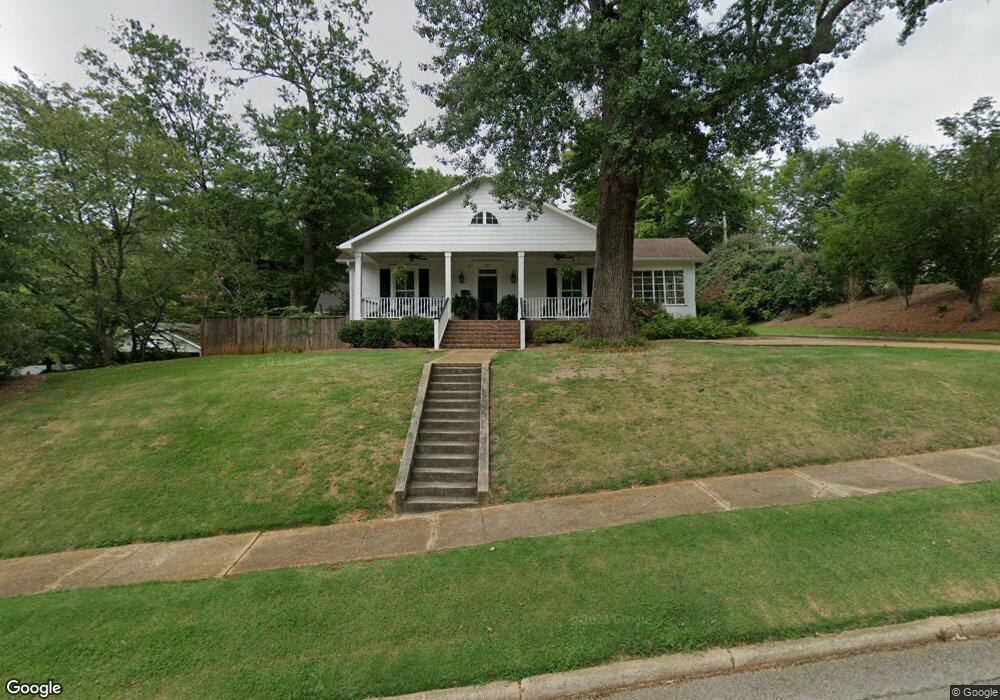
409 E Main St New Albany, MS 38652
Estimated Value: $203,057 - $313,000
Studio
1
Bath
1,878
Sq Ft
$145/Sq Ft
Est. Value
About This Home
This home is located at 409 E Main St, New Albany, MS 38652 and is currently estimated at $273,014, approximately $145 per square foot. 409 E Main St is a home located in Union County with nearby schools including New Albany Elementary School, New Albany/S.Tippah/Union County Alternative School, and New Albany Middle School.
Ownership History
Date
Name
Owned For
Owner Type
Purchase Details
Closed on
Jul 26, 2019
Sold by
Everly Bonnie
Bought by
Keener Kelly O
Current Estimated Value
Home Financials for this Owner
Home Financials are based on the most recent Mortgage that was taken out on this home.
Original Mortgage
$220,500
Outstanding Balance
$192,399
Interest Rate
3.73%
Mortgage Type
New Conventional
Estimated Equity
$80,615
Purchase Details
Closed on
Nov 6, 2012
Sold by
Owen Kenneth Whiteside and Owen Sandra P
Bought by
Everly Bonnie
Create a Home Valuation Report for This Property
The Home Valuation Report is an in-depth analysis detailing your home's value as well as a comparison with similar homes in the area
Home Values in the Area
Average Home Value in this Area
Purchase History
| Date | Buyer | Sale Price | Title Company |
|---|---|---|---|
| Keener Kelly O | -- | None Available | |
| Everly Bonnie | -- | -- |
Source: Public Records
Mortgage History
| Date | Status | Borrower | Loan Amount |
|---|---|---|---|
| Open | Keener Kelly O | $220,500 |
Source: Public Records
Tax History
| Year | Tax Paid | Tax Assessment Tax Assessment Total Assessment is a certain percentage of the fair market value that is determined by local assessors to be the total taxable value of land and additions on the property. | Land | Improvement |
|---|---|---|---|---|
| 2025 | $1,200 | $10,200 | $0 | $0 |
| 2024 | $1,160 | $10,200 | $0 | $0 |
| 2023 | $1,165 | $10,200 | $0 | $0 |
| 2022 | $818 | $7,757 | $0 | $0 |
| 2021 | $787 | $7,757 | $0 | $0 |
| 2020 | $787 | $7,757 | $0 | $0 |
| 2019 | $787 | $7,757 | $0 | $0 |
| 2018 | $732 | $7,367 | $0 | $0 |
| 2017 | $661 | $6,922 | $0 | $0 |
| 2016 | $629 | $6,922 | $0 | $0 |
| 2015 | -- | $6,922 | $0 | $0 |
| 2014 | -- | $6,739 | $0 | $0 |
Source: Public Records
Map
Nearby Homes
Your Personal Tour Guide
Ask me questions while you tour the home.