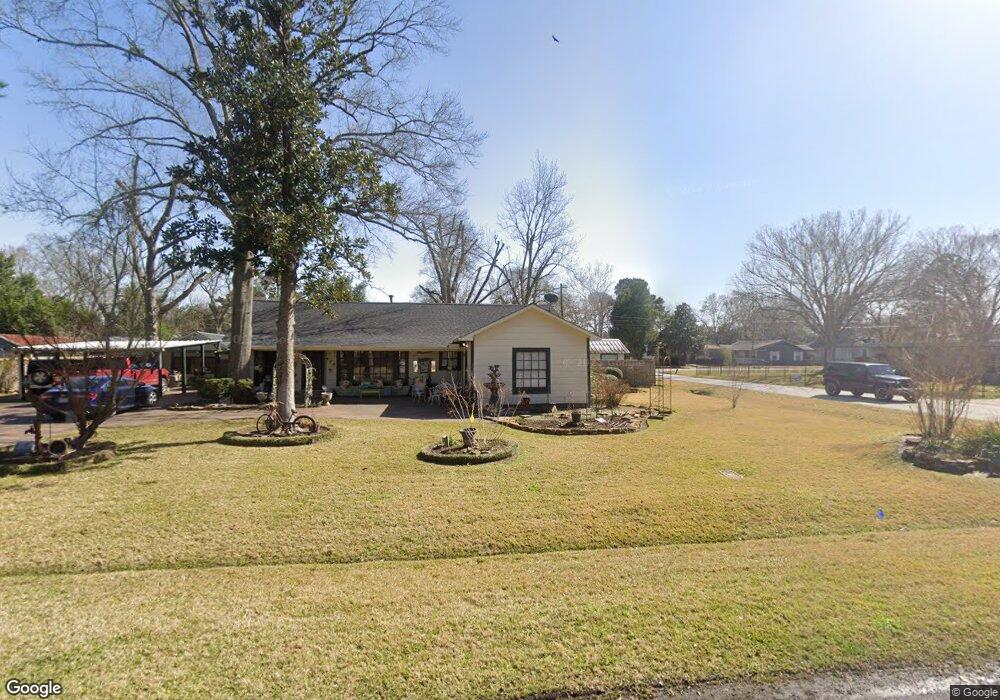
409 Florence St Tomball, TX 77375
Estimated Value: $341,000 - $508,000
3
Beds
2
Baths
1,792
Sq Ft
$245/Sq Ft
Est. Value
About This Home
This home is located at 409 Florence St, Tomball, TX 77375 and is currently estimated at $439,205, approximately $245 per square foot. 409 Florence St is a home located in Harris County with nearby schools including Tomball Elementary School, Tomball Intermediate School, and Tomball Junior High School.
Ownership History
Date
Name
Owned For
Owner Type
Purchase Details
Closed on
May 25, 2011
Sold by
Armendariz Monica
Bought by
Bonnett James R and Bonnett Lisa A
Current Estimated Value
Purchase Details
Closed on
Jul 19, 2007
Sold by
Langston John and Langston Claudette
Bought by
Armendariz Monica
Purchase Details
Closed on
Sep 6, 2005
Sold by
Langston Florean
Bought by
Langston John
Purchase Details
Closed on
Aug 24, 1995
Sold by
Chambers David M and Chambers Dena L
Bought by
Bonnett James R and Bonnett Lisa Ann
Home Financials for this Owner
Home Financials are based on the most recent Mortgage that was taken out on this home.
Original Mortgage
$71,100
Interest Rate
7.39%
Mortgage Type
Purchase Money Mortgage
Create a Home Valuation Report for This Property
The Home Valuation Report is an in-depth analysis detailing your home's value as well as a comparison with similar homes in the area
Home Values in the Area
Average Home Value in this Area
Purchase History
| Date | Buyer | Sale Price | Title Company |
|---|---|---|---|
| Bonnett James R | -- | Stewart Title Houston Div | |
| Armendariz Monica | -- | Stewart Title Houston Div | |
| Langston John | -- | -- | |
| Bonnett James R | -- | Fidelity National Title |
Source: Public Records
Mortgage History
| Date | Status | Borrower | Loan Amount |
|---|---|---|---|
| Previous Owner | Bonnett James R | $71,100 |
Source: Public Records
Tax History Compared to Growth
Tax History
| Year | Tax Paid | Tax Assessment Tax Assessment Total Assessment is a certain percentage of the fair market value that is determined by local assessors to be the total taxable value of land and additions on the property. | Land | Improvement |
|---|---|---|---|---|
| 2025 | $6,609 | $488,368 | $301,403 | $186,965 |
| 2024 | $6,609 | $501,205 | $281,309 | $219,896 |
| 2023 | $6,609 | $413,926 | $241,122 | $172,804 |
| 2022 | $6,862 | $370,774 | $180,842 | $189,932 |
| 2021 | $6,493 | $273,755 | $130,608 | $143,147 |
| 2020 | $6,181 | $252,022 | $100,468 | $151,554 |
| 2019 | $5,984 | $237,196 | $80,374 | $156,822 |
| 2018 | $661 | $49,353 | $42,000 | $7,353 |
| 2017 | $3,879 | $49,353 | $42,000 | $7,353 |
| 2016 | $4,099 | $49,353 | $42,000 | $7,353 |
| 2015 | $1,256 | $49,353 | $42,000 | $7,353 |
| 2014 | $1,256 | $49,353 | $42,000 | $7,353 |
Source: Public Records
Map
Nearby Homes
- 516 Clayton St
- 505 Percival St
- TBD Clayton St
- 504 Percival St Unit A
- 109 Mcphail St
- 20734 Open Range Ct
- 18818 Cornelia Fields Ln
- 18723 Buttercup Farms Ln
- 20718 Open Range Ct
- 19951 Epona Creek Dr
- 19935 Epona Creek Dr
- 18707 Buttercup Farms Ln
- 18826 Cornelia Fields Ln
- 20714 Open Range Ct
- 204 Vernon St
- 200 S Vernon St
- 104 Anna St
- 0 N Sycamore St
- 315 Mechanic St
- TBD Mechanic St
- 412 S Pine St
- 404 S Pine St
- 405 Florence St
- 410 Mcphail St
- 410 Mcphail St Unit B
- 410 Mcphail St Unit A
- 504 Clayton St
- 403 Florence St
- 410 Florence St
- 408 Mcphail St
- 406 Mc Phail St
- 501 Clayton St
- 508 Clayton St
- 406 Florence St
- 401 Florence St
- 501 Percival St
- 503 Clayton St
- 506 S Oak St
- 402 Florence St
- 510 Clayton St