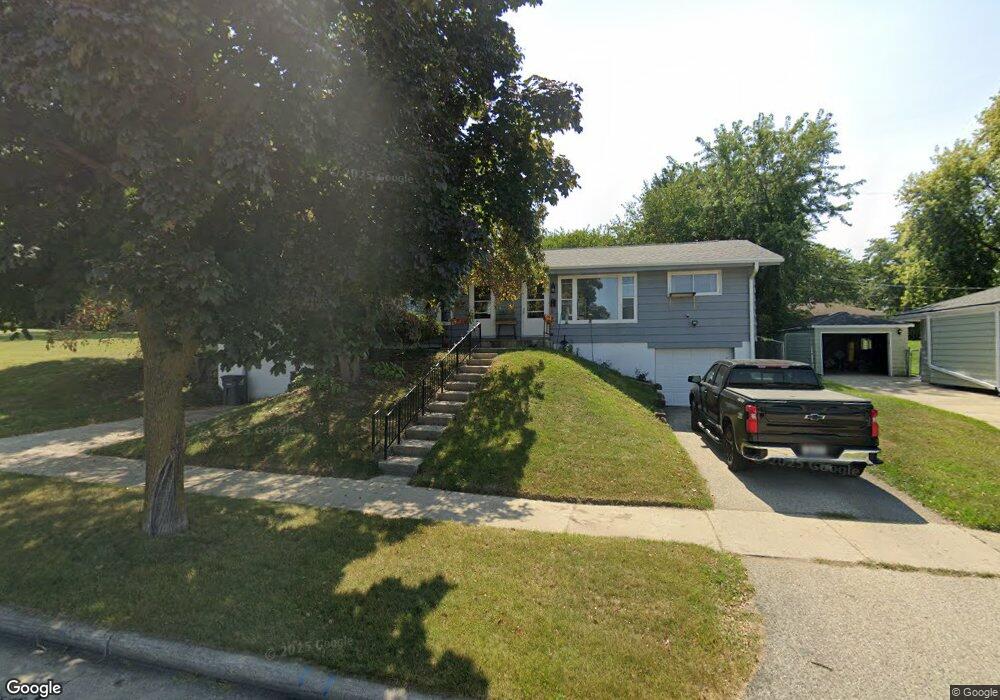
409 Freeman St Unit 411 Waukesha, WI 53189
Estimated Value: $267,583 - $360,000
5
Beds
2
Baths
1,602
Sq Ft
$207/Sq Ft
Est. Value
About This Home
This home is located at 409 Freeman St Unit 411, Waukesha, WI 53189 and is currently estimated at $332,396, approximately $207 per square foot. 409 Freeman St Unit 411 is a home located in Waukesha County with nearby schools including Waukesha STEM Academy, Horning Middle School, and South High School.
Ownership History
Date
Name
Owned For
Owner Type
Purchase Details
Closed on
Jun 25, 2021
Sold by
Kerr Brandon A
Bought by
Gibby Michael and Gibby Jamie
Current Estimated Value
Home Financials for this Owner
Home Financials are based on the most recent Mortgage that was taken out on this home.
Original Mortgage
$211,105
Outstanding Balance
$191,545
Interest Rate
2.9%
Mortgage Type
FHA
Estimated Equity
$140,851
Purchase Details
Closed on
Oct 17, 2012
Sold by
Kerr Brandon A and Estate Of Peter A Kerr
Bought by
Kerr Brandon A
Purchase Details
Closed on
Jan 27, 2003
Sold by
Apuli Gregory W and Apuli Carol J
Bought by
Kerr Peter A
Home Financials for this Owner
Home Financials are based on the most recent Mortgage that was taken out on this home.
Original Mortgage
$119,200
Interest Rate
6.06%
Create a Home Valuation Report for This Property
The Home Valuation Report is an in-depth analysis detailing your home's value as well as a comparison with similar homes in the area
Home Values in the Area
Average Home Value in this Area
Purchase History
| Date | Buyer | Sale Price | Title Company |
|---|---|---|---|
| Gibby Michael | $215,000 | None Available | |
| Kerr Brandon A | -- | None Available | |
| Kerr Peter A | $149,000 | -- |
Source: Public Records
Mortgage History
| Date | Status | Borrower | Loan Amount |
|---|---|---|---|
| Open | Gibby Michael | $211,105 | |
| Previous Owner | Kerr Peter A | $119,200 |
Source: Public Records
Tax History Compared to Growth
Tax History
| Year | Tax Paid | Tax Assessment Tax Assessment Total Assessment is a certain percentage of the fair market value that is determined by local assessors to be the total taxable value of land and additions on the property. | Land | Improvement |
|---|---|---|---|---|
| 2024 | $2,720 | $189,300 | $54,000 | $135,300 |
| 2023 | $2,627 | $189,300 | $54,000 | $135,300 |
| 2022 | $3,626 | $191,500 | $58,400 | $133,100 |
| 2021 | $3,904 | $191,500 | $58,400 | $133,100 |
| 2020 | $3,729 | $191,500 | $58,400 | $133,100 |
| 2019 | $3,633 | $191,500 | $58,400 | $133,100 |
| 2018 | $3,322 | $172,500 | $51,900 | $120,600 |
| 2017 | $3,608 | $172,500 | $51,900 | $120,600 |
| 2016 | $3,411 | $167,500 | $51,900 | $115,600 |
| 2015 | $3,380 | $167,500 | $51,900 | $115,600 |
| 2014 | $3,342 | $162,600 | $51,900 | $110,700 |
| 2013 | $3,421 | $162,600 | $51,900 | $110,700 |
Source: Public Records
Map
Nearby Homes
- 1522 Big Bend Rd Unit G
- 1432 Big Bend Rd Unit E
- 1936 Cliff Alex Ct N
- 113 Coolidge Ave
- 1438 Tenny Ave Unit 101
- The Sequoia Plan at Aspen Overlook
- The Sycamore Plan at Aspen Overlook
- 1436 Tenny Ave Unit 101
- 455 Standing Stone Dr
- 1715 Center Rd
- 312 W Wabash Ave
- 414 Standing Stone Dr Unit 8-16
- 421 Standing Stone Dr Unit 17-39
- 424 Standing Stone Dr Unit 9-17
- 435 Standing Stone Dr Unit 16-37
- 605 Standing Stone Dr
- 609 Standing Stone Dr
- 625 Standing Stone Dr
- 613 Standing Stone Dr
- 621 Standing Stone Dr
- 419 Freeman St Unit 421
- 421 Freeman St
- 401 Freeman St
- 1456 Victoria Dr
- 424 Baird St
- 427 Freeman St
- 404 Baird St
- 435 Freeman St
- 435 Freeman St Unit 437
- 432 Baird St
- 1451 Victoria Dr
- 1451 Victoria Dr Unit 1453
- 416 Baird St
- 405 Baird St
- 415 Baird St
- 425 Baird St
- 1443 Victoria Dr Unit 1445
- 444 Baird St
- 443 Freeman St Unit 445
- 438 Baird St