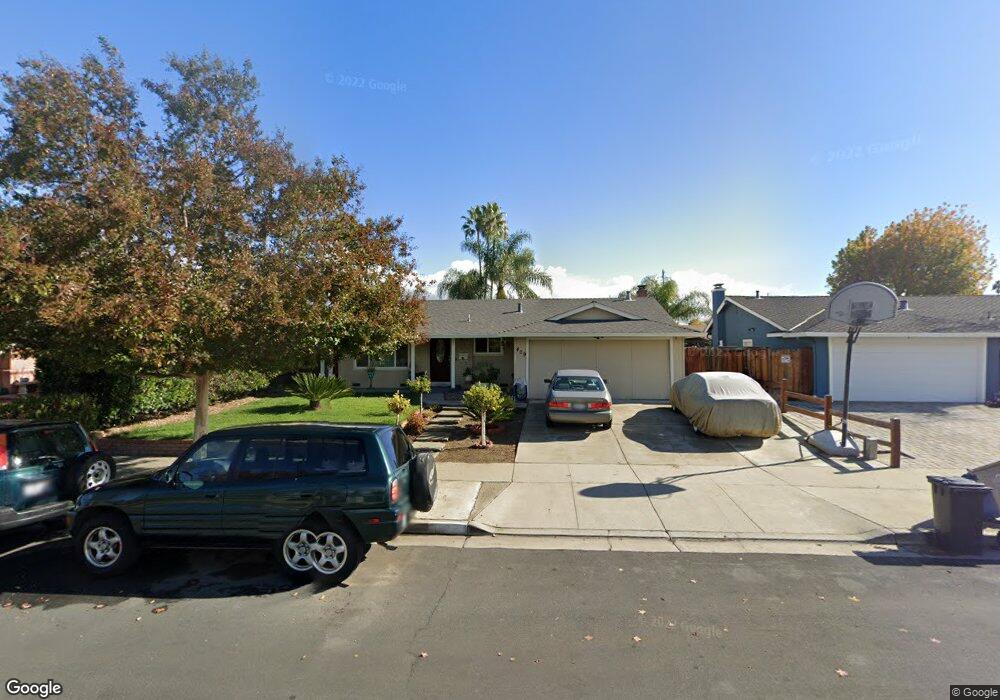
409 Lyoncross Way San Jose, CA 95123
Miner NeighborhoodEstimated Value: $1,328,849 - $1,446,000
3
Beds
2
Baths
1,409
Sq Ft
$990/Sq Ft
Est. Value
About This Home
This home is located at 409 Lyoncross Way, San Jose, CA 95123 and is currently estimated at $1,394,962, approximately $990 per square foot. 409 Lyoncross Way is a home located in Santa Clara County with nearby schools including Oak Ridge Elementary School, Herman (Leonard) Intermediate School, and Oak Grove High School.
Ownership History
Date
Name
Owned For
Owner Type
Purchase Details
Closed on
Nov 7, 2006
Sold by
Torrez Eliezer
Bought by
Tevez Daniel and Moran Felicita
Current Estimated Value
Home Financials for this Owner
Home Financials are based on the most recent Mortgage that was taken out on this home.
Original Mortgage
$70,900
Interest Rate
6.36%
Mortgage Type
Stand Alone Second
Purchase Details
Closed on
Nov 1, 2004
Sold by
Moran Felicita
Bought by
Tevez Daniel
Home Financials for this Owner
Home Financials are based on the most recent Mortgage that was taken out on this home.
Original Mortgage
$448,000
Interest Rate
5.82%
Mortgage Type
Purchase Money Mortgage
Purchase Details
Closed on
Aug 6, 2004
Sold by
Ries Kenneth J and Ries Jan K
Bought by
West Valley Housing Llc
Purchase Details
Closed on
Jul 29, 2004
Sold by
Ries Kenneth J and Ries Jan K
Bought by
Ries Kenneth J and Ries Jan K
Create a Home Valuation Report for This Property
The Home Valuation Report is an in-depth analysis detailing your home's value as well as a comparison with similar homes in the area
Home Values in the Area
Average Home Value in this Area
Purchase History
| Date | Buyer | Sale Price | Title Company |
|---|---|---|---|
| Tevez Daniel | $319,500 | Alliance Title Company | |
| Tevez Daniel | -- | Alliance Title Company | |
| Tevez Daniel | $560,000 | Alliance Title Company | |
| West Valley Housing Llc | -- | -- | |
| Ries Kenneth J | -- | -- |
Source: Public Records
Mortgage History
| Date | Status | Borrower | Loan Amount |
|---|---|---|---|
| Closed | Tevez Daniel | $70,900 | |
| Open | Tevez Daniel | $567,200 | |
| Previous Owner | Tevez Daniel | $448,000 | |
| Closed | Tevez Daniel | $112,000 |
Source: Public Records
Tax History Compared to Growth
Tax History
| Year | Tax Paid | Tax Assessment Tax Assessment Total Assessment is a certain percentage of the fair market value that is determined by local assessors to be the total taxable value of land and additions on the property. | Land | Improvement |
|---|---|---|---|---|
| 2025 | $11,760 | $845,793 | $510,565 | $335,228 |
| 2024 | $11,760 | $829,209 | $500,554 | $328,655 |
| 2023 | $11,580 | $812,951 | $490,740 | $322,211 |
| 2022 | $11,508 | $797,012 | $481,118 | $315,894 |
| 2021 | $11,342 | $781,385 | $471,685 | $309,700 |
| 2020 | $11,096 | $773,374 | $466,849 | $306,525 |
| 2019 | $10,839 | $758,211 | $457,696 | $300,515 |
| 2018 | $10,766 | $743,345 | $448,722 | $294,623 |
| 2017 | $10,622 | $728,771 | $439,924 | $288,847 |
| 2016 | $10,108 | $714,483 | $431,299 | $283,184 |
| 2015 | $9,276 | $656,000 | $396,000 | $260,000 |
| 2014 | $7,885 | $592,000 | $357,400 | $234,600 |
Source: Public Records
Map
Nearby Homes
- 394 Bay St
- 5629 Judith St
- 5631 Herma St
- 379 Roan St
- 480 Chinook Ln
- 482 Calero Ave
- 341 Blossom Hill Rd Unit 3
- 329 Blossom Hill Rd Unit 4
- 5558 Judith St Unit 1
- 323 Blossom Hill Rd Unit 2
- 5506 Sean Cir Unit 112
- 262 Tradewinds Ct Unit 4
- 5532 Spinnaker Dr Unit 2
- 5968 Sorrel Ave
- 5865 Paddon Cir
- 310 Tradewinds Dr Unit 8
- 521 Canton Dr
- 5991 Sorrel Ave
- 275 Tradewinds Dr Unit 11
- 5665 Comanche Dr
- 411 Lyoncross Way
- 407 Lyoncross Way
- 5773 Orchard Park Dr
- 5769 Orchard Park Dr
- 413 Lyoncross Way
- 5777 Orchard Park Dr
- 405 Lyoncross Way
- 5765 Orchard Park Dr
- 5781 Orchard Park Dr
- 410 Lyoncross Way
- 408 Lyoncross Way
- 412 Lyoncross Way
- 415 Lyoncross Way
- 403 Lyoncross Way
- 5761 Orchard Park Dr
- 404 Lyoncross Way
- 414 Lyoncross Way
- 5785 Orchard Park Dr
- 417 Lyoncross Way
- 401 Lyoncross Way