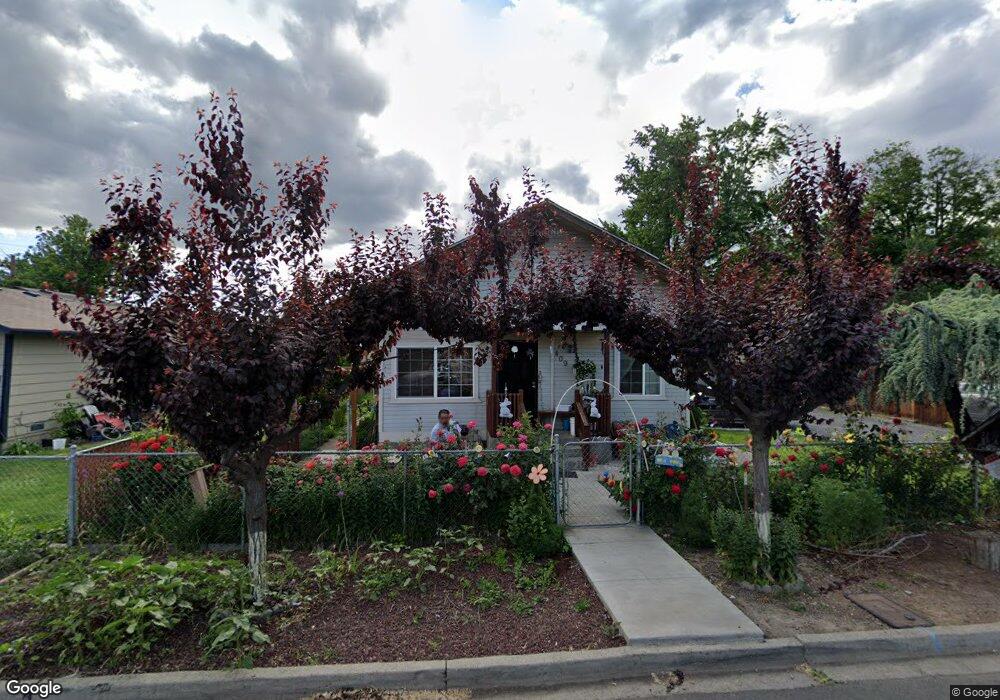
409 Maple Ct Toppenish, WA 98948
Estimated Value: $213,000 - $284,000
3
Beds
3
Baths
1,508
Sq Ft
$175/Sq Ft
Est. Value
About This Home
This home is located at 409 Maple Ct, Toppenish, WA 98948 and is currently estimated at $264,633, approximately $175 per square foot. 409 Maple Ct is a home located in Yakima County with nearby schools including Toppenish High School.
Ownership History
Date
Name
Owned For
Owner Type
Purchase Details
Closed on
Nov 23, 1998
Sold by
Montoya Rodolfo and Roman Maria C
Bought by
Castel Martin and Castel Ermila R
Current Estimated Value
Home Financials for this Owner
Home Financials are based on the most recent Mortgage that was taken out on this home.
Original Mortgage
$85,000
Interest Rate
10%
Purchase Details
Closed on
Nov 17, 1998
Sold by
Montoya Rodolfo and Roman Maria C
Bought by
Castel Martin and Castel Ermila R
Home Financials for this Owner
Home Financials are based on the most recent Mortgage that was taken out on this home.
Original Mortgage
$85,000
Interest Rate
10%
Create a Home Valuation Report for This Property
The Home Valuation Report is an in-depth analysis detailing your home's value as well as a comparison with similar homes in the area
Home Values in the Area
Average Home Value in this Area
Purchase History
| Date | Buyer | Sale Price | Title Company |
|---|---|---|---|
| Castel Martin | $84,673 | Pacific Alliance Title Co | |
| Castel Martin | $85,000 | -- |
Source: Public Records
Mortgage History
| Date | Status | Borrower | Loan Amount |
|---|---|---|---|
| Previous Owner | Castel Martin | $85,000 |
Source: Public Records
Tax History Compared to Growth
Tax History
| Year | Tax Paid | Tax Assessment Tax Assessment Total Assessment is a certain percentage of the fair market value that is determined by local assessors to be the total taxable value of land and additions on the property. | Land | Improvement |
|---|---|---|---|---|
| 2025 | $609 | $243,600 | $31,600 | $212,000 |
| 2023 | $2,049 | $158,800 | $33,300 | $125,500 |
| 2022 | $2,302 | $204,300 | $33,100 | $171,200 |
| 2021 | $3,283 | $146,500 | $25,800 | $120,700 |
| 2019 | $1,478 | $126,700 | $25,800 | $100,900 |
| 2018 | $1,230 | $104,800 | $25,800 | $79,000 |
| 2017 | $1,068 | $102,100 | $25,800 | $76,300 |
| 2016 | $1,066 | $103,200 | $25,800 | $77,400 |
| 2015 | $1,066 | $100,400 | $25,800 | $74,600 |
| 2014 | $1,066 | $100,300 | $25,700 | $74,600 |
| 2013 | $1,066 | $100,300 | $25,700 | $74,600 |
Source: Public Records
Map
Nearby Homes