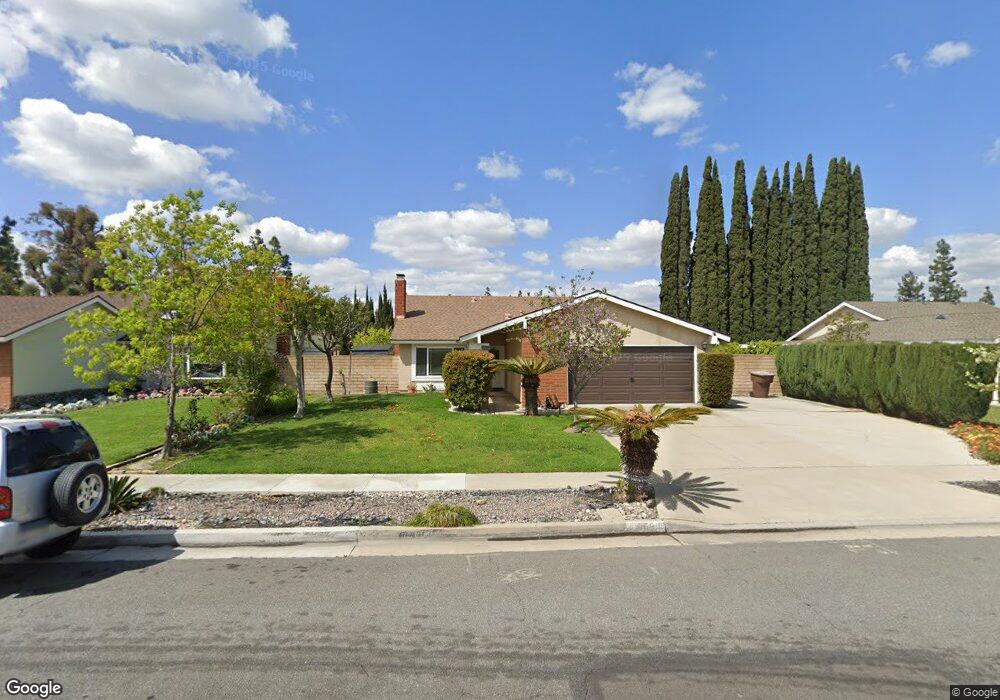
409 N Shasta St Anaheim, CA 92807
Anaheim Hills NeighborhoodEstimated Value: $964,567 - $1,021,000
4
Beds
2
Baths
1,480
Sq Ft
$666/Sq Ft
Est. Value
About This Home
This home is located at 409 N Shasta St, Anaheim, CA 92807 and is currently estimated at $986,142, approximately $666 per square foot. 409 N Shasta St is a home located in Orange County with nearby schools including Olive Elementary School, Canyon High School, and El Rancho Charter.
Ownership History
Date
Name
Owned For
Owner Type
Purchase Details
Closed on
Dec 21, 2017
Sold by
Trifa Anca
Bought by
Trifa Anca and Anca Trifa Trust
Current Estimated Value
Purchase Details
Closed on
Mar 26, 2008
Sold by
Ecdao Kathryn and Ecdao Cesar
Bought by
Trifa Anca
Home Financials for this Owner
Home Financials are based on the most recent Mortgage that was taken out on this home.
Original Mortgage
$386,570
Outstanding Balance
$241,665
Interest Rate
5.72%
Mortgage Type
Purchase Money Mortgage
Estimated Equity
$744,477
Purchase Details
Closed on
Oct 16, 2003
Sold by
Evangelical Friends Church Southwest
Bought by
Ecdao Cesar and Ecdao Kathryn
Home Financials for this Owner
Home Financials are based on the most recent Mortgage that was taken out on this home.
Original Mortgage
$360,000
Interest Rate
5.99%
Mortgage Type
Purchase Money Mortgage
Purchase Details
Closed on
Apr 24, 2001
Sold by
Murillo Frank
Bought by
Friends Church Southwest Yearly Meeting
Purchase Details
Closed on
Apr 5, 2000
Sold by
Mulhollen Margie R
Bought by
Mulhollen Living Trust
Create a Home Valuation Report for This Property
The Home Valuation Report is an in-depth analysis detailing your home's value as well as a comparison with similar homes in the area
Home Values in the Area
Average Home Value in this Area
Purchase History
| Date | Buyer | Sale Price | Title Company |
|---|---|---|---|
| Trifa Anca | -- | None Available | |
| Trifa Anca | $430,000 | Lawyers Title Company | |
| Ecdao Cesar | $450,000 | Stewart Title | |
| Friends Church Southwest Yearly Meeting | $280,000 | -- | |
| Mulhollen Living Trust | -- | -- |
Source: Public Records
Mortgage History
| Date | Status | Borrower | Loan Amount |
|---|---|---|---|
| Open | Trifa Anca | $386,570 | |
| Previous Owner | Ecdao Cesar | $360,000 | |
| Closed | Ecdao Cesar | $90,000 |
Source: Public Records
Tax History Compared to Growth
Tax History
| Year | Tax Paid | Tax Assessment Tax Assessment Total Assessment is a certain percentage of the fair market value that is determined by local assessors to be the total taxable value of land and additions on the property. | Land | Improvement |
|---|---|---|---|---|
| 2025 | $6,171 | $564,804 | $443,056 | $121,748 |
| 2024 | $6,171 | $553,730 | $434,369 | $119,361 |
| 2023 | $6,033 | $542,873 | $425,852 | $117,021 |
| 2022 | $5,914 | $532,229 | $417,502 | $114,727 |
| 2021 | $5,749 | $521,794 | $409,316 | $112,478 |
| 2020 | $5,695 | $516,444 | $405,119 | $111,325 |
| 2019 | $5,623 | $506,318 | $397,175 | $109,143 |
| 2018 | $5,536 | $496,391 | $389,388 | $107,003 |
| 2017 | $5,306 | $486,658 | $381,753 | $104,905 |
| 2016 | $5,203 | $477,116 | $374,267 | $102,849 |
| 2015 | $5,134 | $469,950 | $368,645 | $101,305 |
| 2014 | $5,024 | $460,745 | $361,424 | $99,321 |
Source: Public Records
Map
Nearby Homes
- 4864 E Mckinnon Dr
- 4809 E Wasatch Dr
- 4433 E Lani Ave
- 5059 E Crescent Dr
- 408 N Torrens St
- 1712 N Glenview Ave
- 1963 Via de la Luna
- 1952 Avenida Del Sol
- 1958 Avenida Del Sol
- 1664 Via de la Luna
- 4568 E Meadowhill Ave
- 18501 Woodwind Ln
- 420 S Rolling Hills Place
- 580 S Londerry Ln
- 451 S Wishing Well Ln
- 5018 E Budlong St
- 2017 Orchard Dr Unit 11
- 5291 E Rural Ridge Cir
- 2024 Tanforan Ave
- 1833 Taft Ln
- 413 N Shasta St
- 405 N Shasta St
- 417 N Shasta St
- 401 N Shasta St
- 4710 E Parkrose Cir
- 4711 E Mckinnon Dr
- 4711 E Parkrose Cir
- 421 N Shasta St
- 4716 E Parkrose Cir
- 4717 E Mckinnon Dr
- 4710 E Astoria Cir
- 4717 E Parkrose Cir
- 425 N Shasta St
- 4708 E Mckinnon Dr
- 4710 E Mckinnon Dr
- 4716 E Astoria Cir
- 4724 E Parkrose Cir
- 4725 E Mckinnon Dr
- 4725 E Parkrose Cir
- 429 N Shasta St