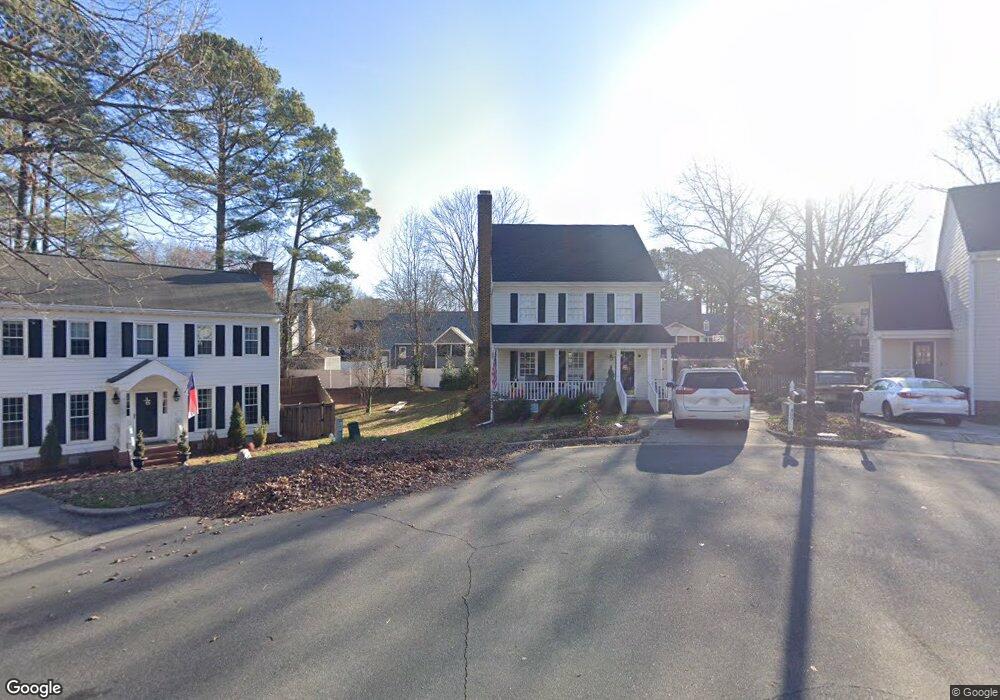
409 Robb Ct Raleigh, NC 27615
Estimated Value: $483,000 - $507,000
3
Beds
3
Baths
1,460
Sq Ft
$339/Sq Ft
Est. Value
About This Home
This home is located at 409 Robb Ct, Raleigh, NC 27615 and is currently estimated at $494,568, approximately $338 per square foot. 409 Robb Ct is a home located in Wake County with nearby schools including North Ridge Elementary School, West Millbrook Middle School, and Sanderson High School.
Ownership History
Date
Name
Owned For
Owner Type
Purchase Details
Closed on
Jan 12, 2011
Sold by
Johnson Amy Dianne and Harris Amy J
Bought by
Leggett Matthew and Leggett Kara Norville
Current Estimated Value
Home Financials for this Owner
Home Financials are based on the most recent Mortgage that was taken out on this home.
Original Mortgage
$192,000
Outstanding Balance
$130,712
Interest Rate
4.75%
Mortgage Type
New Conventional
Estimated Equity
$363,856
Purchase Details
Closed on
Jan 25, 2007
Sold by
Harris Shane K
Bought by
Harris Amy J
Purchase Details
Closed on
Apr 29, 2003
Sold by
Holland Paul C and Holland Mickie P
Bought by
Harris Shane K and Harris Amy J
Home Financials for this Owner
Home Financials are based on the most recent Mortgage that was taken out on this home.
Original Mortgage
$152,100
Interest Rate
5.79%
Create a Home Valuation Report for This Property
The Home Valuation Report is an in-depth analysis detailing your home's value as well as a comparison with similar homes in the area
Home Values in the Area
Average Home Value in this Area
Purchase History
| Date | Buyer | Sale Price | Title Company |
|---|---|---|---|
| Leggett Matthew | $192,000 | None Available | |
| Harris Amy J | -- | None Available | |
| Harris Shane K | $169,000 | -- |
Source: Public Records
Mortgage History
| Date | Status | Borrower | Loan Amount |
|---|---|---|---|
| Open | Leggett Matthew | $192,000 | |
| Previous Owner | Harris Shane K | $152,100 |
Source: Public Records
Tax History Compared to Growth
Tax History
| Year | Tax Paid | Tax Assessment Tax Assessment Total Assessment is a certain percentage of the fair market value that is determined by local assessors to be the total taxable value of land and additions on the property. | Land | Improvement |
|---|---|---|---|---|
| 2025 | $3,827 | $436,492 | $125,000 | $311,492 |
| 2024 | $3,811 | $436,492 | $125,000 | $311,492 |
| 2023 | $3,112 | $283,712 | $98,000 | $185,712 |
| 2022 | $2,893 | $283,712 | $98,000 | $185,712 |
| 2021 | $2,781 | $283,712 | $98,000 | $185,712 |
| 2020 | $2,730 | $283,712 | $98,000 | $185,712 |
| 2019 | $2,816 | $241,265 | $100,000 | $141,265 |
| 2018 | $2,656 | $241,265 | $100,000 | $141,265 |
| 2017 | $2,530 | $241,265 | $100,000 | $141,265 |
| 2016 | $2,478 | $241,265 | $100,000 | $141,265 |
| 2015 | $2,380 | $227,892 | $84,000 | $143,892 |
| 2014 | $2,257 | $227,892 | $84,000 | $143,892 |
Source: Public Records
Map
Nearby Homes
- 6600 Portsmouth Ln
- 6725 Eastbrook Dr
- 6729 Eastbrook Dr
- 6717 Ascot Ct
- 705 Villawood Ct
- 128 Ammons Dr
- 7010 Sandy Forks Rd Unit 103
- 106 N Trail Dr
- 6716 Ridgecroft Ln
- 7050 Sandy Forks Rd Unit 101
- 250 Ashton Hall Ln
- 222 Ashton Hall Ln
- 5946 Carmel Ln
- 6106 Friars Walk Place
- 5838 Branchwood Rd
- 408 Troy Place
- 6433 New Market Way
- 906 Albany Ct
- 5830 Whitebud Dr
- 6303 New Market Way
- 405 Robb Ct
- 408 Robb Ct
- 6609 Portsmouth Ln
- 6613 Portsmouth Ln
- 6605 Portsmouth Ln
- 404 Robb Ct
- 401 Robb Ct
- 504 Maylands Ave
- 400 Robb Ct
- 6601 Portsmouth Ln
- 6621 Portsmouth Ln
- 408 Maylands Ave
- 508 Maylands Ave
- 404 Maylands Ave
- 6620 Portsmouth Ln
- 6616 Portsmouth Ln
- 6625 Portsmouth Ln
- 6624 Portsmouth Ln
- 6612 Portsmouth Ln
- 509 Maylands Ave