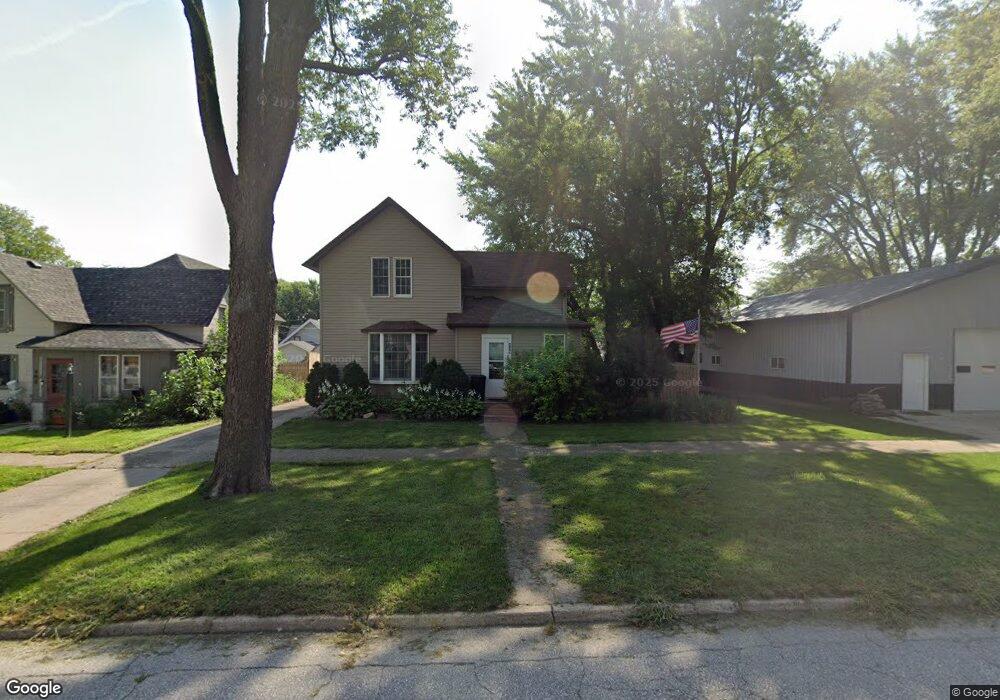
409 S Maple St Odebolt, IA 51458
Estimated Value: $86,256 - $108,000
Studio
1
Bath
1,205
Sq Ft
$78/Sq Ft
Est. Value
About This Home
This home is located at 409 S Maple St, Odebolt, IA 51458 and is currently estimated at $93,564, approximately $77 per square foot. 409 S Maple St is a home located in Sac County with nearby schools including Odebolt Arthur Battle Creek Ida Grove Elementary - Odebolt, Odebolt Arthur Battle Creek Ida Grove Middle School, and Odebolt Arthur Battle Creek Ida Grove High School.
Ownership History
Date
Name
Owned For
Owner Type
Purchase Details
Closed on
Jun 28, 2023
Sold by
Hustedt Bryce
Bought by
Miller Chase
Current Estimated Value
Home Financials for this Owner
Home Financials are based on the most recent Mortgage that was taken out on this home.
Original Mortgage
$54,800
Outstanding Balance
$51,198
Interest Rate
6.57%
Mortgage Type
New Conventional
Estimated Equity
$42,366
Create a Home Valuation Report for This Property
The Home Valuation Report is an in-depth analysis detailing your home's value as well as a comparison with similar homes in the area
Purchase History
| Date | Buyer | Sale Price | Title Company |
|---|---|---|---|
| Miller Chase | $68,500 | None Listed On Document |
Source: Public Records
Mortgage History
| Date | Status | Borrower | Loan Amount |
|---|---|---|---|
| Open | Miller Chase | $54,800 |
Source: Public Records
Tax History
| Year | Tax Paid | Tax Assessment Tax Assessment Total Assessment is a certain percentage of the fair market value that is determined by local assessors to be the total taxable value of land and additions on the property. | Land | Improvement |
|---|---|---|---|---|
| 2025 | $1,072 | $74,000 | $3,300 | $70,700 |
| 2024 | $1,072 | $64,680 | $3,000 | $61,680 |
| 2023 | $922 | $64,680 | $3,000 | $61,680 |
| 2022 | $890 | $47,700 | $3,000 | $44,700 |
| 2021 | $890 | $47,700 | $3,000 | $44,700 |
| 2020 | $992 | $40,900 | $3,000 | $37,900 |
| 2019 | $940 | $51,530 | $3,000 | $48,530 |
| 2018 | $874 | $50,610 | $0 | $0 |
| 2017 | $874 | $48,010 | $0 | $0 |
| 2016 | $902 | $48,190 | $0 | $0 |
| 2015 | $902 | $48,190 | $0 | $0 |
| 2014 | $870 | $48,190 | $0 | $0 |
Source: Public Records
Map
Nearby Homes
- 405 S Maple St
- 417 S Maple St
- 401 S Maple St
- 410 S Walnut St
- 408 S Main St
- 408 S Main St Unit 1
- 412 S Main St
- 412 S Main St
- 404 S Main St
- 416 S Main St
- 420 S Main St
- 104 W 4th St
- 416 S Maple St
- 408 S Maple St
- 404 S Maple St
- 400 S Maple St Unit 443
- 501 S Maple St
- 209 W 5th St
- 111 W 4th St
- 317 S Maple St
Your Personal Tour Guide
Ask me questions while you tour the home.