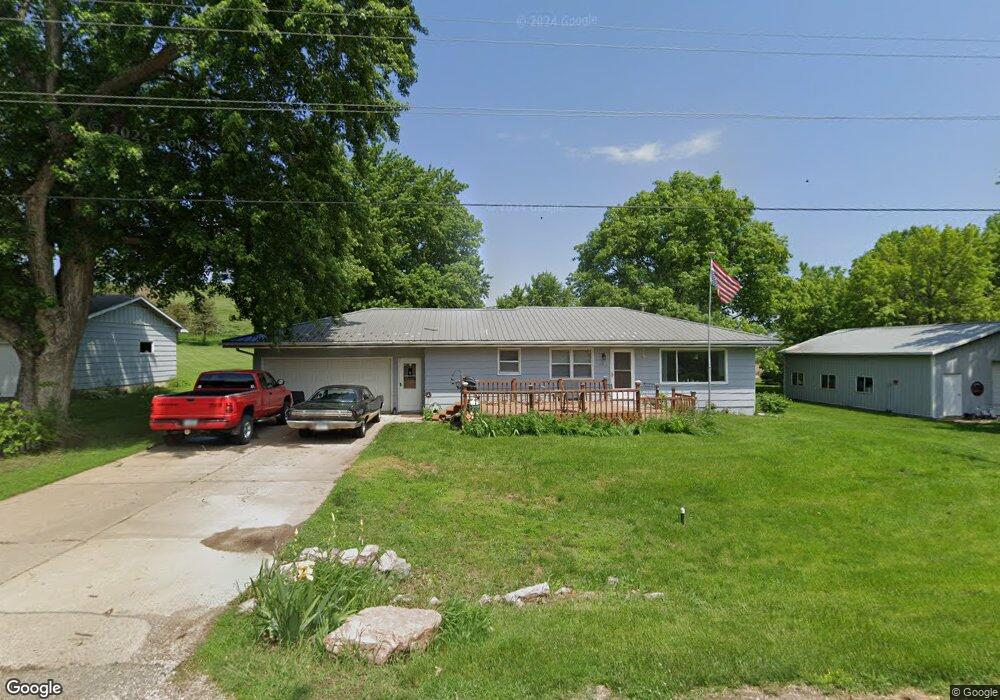
409 W Main St Anthon, IA 51004
Estimated Value: $137,000 - $172,000
3
Beds
2
Baths
1,232
Sq Ft
$130/Sq Ft
Est. Value
About This Home
This home is located at 409 W Main St, Anthon, IA 51004 and is currently estimated at $160,213, approximately $130 per square foot. 409 W Main St is a home located in Woodbury County with nearby schools including Anthon Elementary School, Mvao Middle School, and Maple Valley-Anthon Oto High School.
Ownership History
Date
Name
Owned For
Owner Type
Purchase Details
Closed on
Sep 7, 2012
Sold by
Bumsted Larry G and Bumsted Jean A
Bought by
Bumsted Mark A and Bumsted Diane E
Current Estimated Value
Home Financials for this Owner
Home Financials are based on the most recent Mortgage that was taken out on this home.
Original Mortgage
$100,000
Interest Rate
3.48%
Mortgage Type
Future Advance Clause Open End Mortgage
Create a Home Valuation Report for This Property
The Home Valuation Report is an in-depth analysis detailing your home's value as well as a comparison with similar homes in the area
Home Values in the Area
Average Home Value in this Area
Purchase History
| Date | Buyer | Sale Price | Title Company |
|---|---|---|---|
| Bumsted Mark A | $100,000 | None Available |
Source: Public Records
Mortgage History
| Date | Status | Borrower | Loan Amount |
|---|---|---|---|
| Previous Owner | Bumsted Mark A | $100,000 |
Source: Public Records
Tax History Compared to Growth
Tax History
| Year | Tax Paid | Tax Assessment Tax Assessment Total Assessment is a certain percentage of the fair market value that is determined by local assessors to be the total taxable value of land and additions on the property. | Land | Improvement |
|---|---|---|---|---|
| 2025 | $1,368 | $144,700 | $10,000 | $134,700 |
| 2024 | $1,368 | $123,510 | $10,000 | $113,510 |
| 2023 | $1,568 | $123,510 | $10,000 | $113,510 |
| 2022 | $1,532 | $92,620 | $10,000 | $82,620 |
| 2021 | $1,532 | $92,620 | $10,000 | $82,620 |
| 2020 | $1,678 | $97,000 | $10,700 | $86,300 |
| 2019 | $1,730 | $97,000 | $10,700 | $86,300 |
| 2018 | $1,712 | $96,410 | $10,700 | $85,710 |
| 2017 | $1,658 | $96,410 | $10,700 | $85,710 |
| 2016 | $1,406 | $91,970 | $0 | $0 |
| 2015 | $1,373 | $85,950 | $10,000 | $75,950 |
| 2014 | $1,353 | $80,520 | $10,000 | $70,520 |
Source: Public Records
Map
Nearby Homes
- 405 W Main St
- 501 W Main St
- 408 W Bridge St
- 309 W Main St
- 309 W Main St
- 500 W Bridge St
- 400 W Bridge St
- 502 W Main St
- 306 W Main St
- 400 W Main St
- 300 W Bridge St
- 300 W Bridge St
- 300 W Bridge St
- 207 W Main St
- 300 W Main St
- 307 W Randolph St
- 305 W Randolph St
- 601 W Main St
- 208 W Main St
- 301 W Randolph St