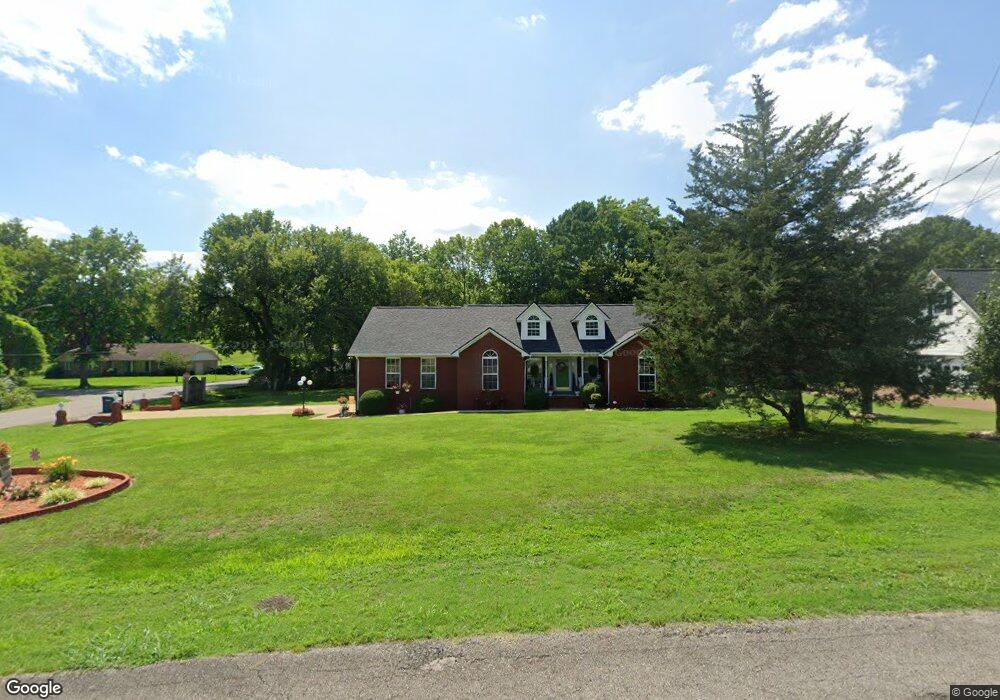
409 Westgate Dr Pulaski, TN 38478
Estimated Value: $243,081 - $318,000
Studio
2
Baths
1,634
Sq Ft
$175/Sq Ft
Est. Value
About This Home
This home is located at 409 Westgate Dr, Pulaski, TN 38478 and is currently estimated at $285,770, approximately $174 per square foot. 409 Westgate Dr is a home located in Giles County with nearby schools including Pulaski Elementary School, Southside Elementary School, and Bridgeforth Middle School.
Ownership History
Date
Name
Owned For
Owner Type
Purchase Details
Closed on
Dec 19, 2003
Sold by
Cendant Mobility Financial
Bought by
Randolph Remonia E
Current Estimated Value
Home Financials for this Owner
Home Financials are based on the most recent Mortgage that was taken out on this home.
Original Mortgage
$112,337
Outstanding Balance
$55,213
Interest Rate
5.82%
Estimated Equity
$230,557
Purchase Details
Closed on
Nov 18, 2003
Bought by
Randolph Remonia E
Home Financials for this Owner
Home Financials are based on the most recent Mortgage that was taken out on this home.
Original Mortgage
$112,337
Outstanding Balance
$55,213
Interest Rate
5.82%
Estimated Equity
$230,557
Purchase Details
Closed on
Sep 14, 2003
Bought by
Cendant Mobility Financial Corporation
Purchase Details
Closed on
May 25, 2000
Sold by
Flippo David M
Bought by
Lejeune Jaems R
Purchase Details
Closed on
Aug 5, 1996
Sold by
Brindley Homes Corp
Bought by
Flippo David and Flippo Bonnie
Create a Home Valuation Report for This Property
The Home Valuation Report is an in-depth analysis detailing your home's value as well as a comparison with similar homes in the area
Home Values in the Area
Average Home Value in this Area
Purchase History
| Date | Buyer | Sale Price | Title Company |
|---|---|---|---|
| Randolph Remonia E | $118,250 | -- | |
| Randolph Remonia E | $118,300 | -- | |
| Cendant Mobility Financial Corporation | $118,300 | -- | |
| Lejeune Jaems R | $113,500 | -- | |
| Flippo David | $101,000 | -- |
Source: Public Records
Mortgage History
| Date | Status | Borrower | Loan Amount |
|---|---|---|---|
| Open | Flippo David | $112,337 |
Source: Public Records
Tax History
| Year | Tax Paid | Tax Assessment Tax Assessment Total Assessment is a certain percentage of the fair market value that is determined by local assessors to be the total taxable value of land and additions on the property. | Land | Improvement |
|---|---|---|---|---|
| 2025 | $1,573 | $57,700 | $7,100 | $50,600 |
| 2024 | $1,389 | $57,700 | $7,100 | $50,600 |
| 2023 | $1,389 | $57,700 | $7,100 | $50,600 |
| 2022 | $1,389 | $57,700 | $7,100 | $50,600 |
| 2021 | $1,043 | $30,800 | $3,175 | $27,625 |
| 2020 | $1,043 | $30,800 | $3,175 | $27,625 |
| 2019 | $870 | $30,800 | $3,175 | $27,625 |
| 2018 | $1,043 | $30,800 | $3,175 | $27,625 |
| 2017 | $1,043 | $30,800 | $3,175 | $27,625 |
| 2016 | $1,123 | $31,700 | $3,125 | $28,575 |
| 2015 | $1,059 | $31,700 | $3,125 | $28,575 |
| 2014 | $1,059 | $31,707 | $0 | $0 |
Source: Public Records
Map
Nearby Homes
- 0 Campbellsville Rd Unit RTC3168340
- 120 Sunset Dr
- 102 Sunset Dr
- 187 Garland Dr
- 1 Chicken Creek Rd
- 1336 Charlotte Ct
- 1011 Vales Mill Rd
- 411 Mountain View Dr
- 226 Rose St
- 846 Red Bud Ln
- 402 Fort Hill Dr
- 420 Fort Hill Dr
- 2605 Columbia Hwy
- 1307 Carroll Dr
- 2787 Columbia Hwy
- 300 Morris St
- 0 N 3rd St
- 0 Jackson Dr Unit RTC3067618
- 1811 Columbia Hwy
- 339 W Washington St
Your Personal Tour Guide
Ask me questions while you tour the home.