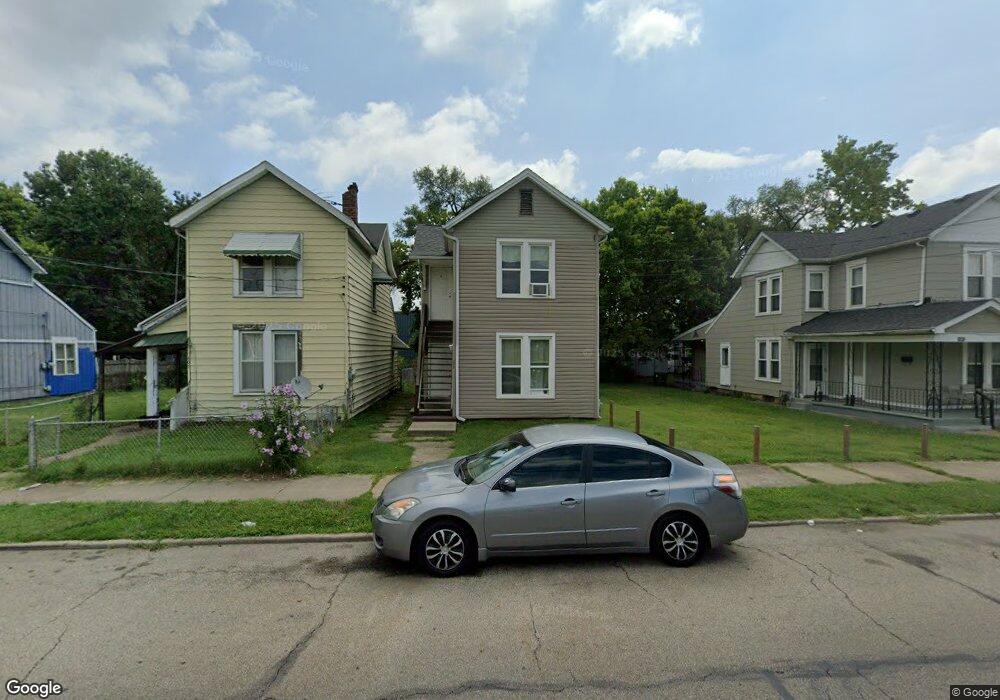
409 Yankee Rd Middletown, OH 45044
South Middletown NeighborhoodEstimated Value: $89,000 - $115,000
4
Beds
2
Baths
1,856
Sq Ft
$57/Sq Ft
Est. Value
About This Home
This home is located at 409 Yankee Rd, Middletown, OH 45044 and is currently estimated at $105,821, approximately $57 per square foot. 409 Yankee Rd is a home located in Butler County with nearby schools including Rosa Parks Elementary School, Highview 6th Grade Center, and Middletown Middle School.
Ownership History
Date
Name
Owned For
Owner Type
Purchase Details
Closed on
Sep 13, 2010
Sold by
Frasik Family Llc
Bought by
Neal Joshuwa A
Current Estimated Value
Home Financials for this Owner
Home Financials are based on the most recent Mortgage that was taken out on this home.
Original Mortgage
$35,000
Outstanding Balance
$22,637
Interest Rate
4.27%
Mortgage Type
Seller Take Back
Estimated Equity
$83,184
Purchase Details
Closed on
Jun 9, 2010
Sold by
Heath Robert
Bought by
Frasik Family Llc
Purchase Details
Closed on
Oct 28, 2009
Sold by
Stonecrest Income & Opportunity Fund I L
Bought by
Heath Robert
Purchase Details
Closed on
Oct 20, 2009
Sold by
Paramount Land Holdings Llc
Bought by
Stonecrest Income & Opportunity Fund I L
Purchase Details
Closed on
Jan 30, 2009
Sold by
Deutsche Bank National Trust Company
Bought by
Paramount Holding Llc
Purchase Details
Closed on
Oct 15, 2008
Sold by
Sexton Bill G and Sexton William
Bought by
Deutsche Bank National Trust Company
Purchase Details
Closed on
Nov 15, 2006
Sold by
Simmons Lanney A and Simmons Linda J
Bought by
Sexton Bill G and Earls Denise L
Home Financials for this Owner
Home Financials are based on the most recent Mortgage that was taken out on this home.
Original Mortgage
$63,750
Interest Rate
10.5%
Mortgage Type
Purchase Money Mortgage
Purchase Details
Closed on
Sep 13, 2001
Sold by
Simmons Lanney A and Simmons Linda J
Bought by
Bowlin Donald E
Home Financials for this Owner
Home Financials are based on the most recent Mortgage that was taken out on this home.
Original Mortgage
$29,000
Interest Rate
7%
Mortgage Type
Seller Take Back
Purchase Details
Closed on
Apr 23, 1999
Sold by
Simmons Lanney
Bought by
Carrel Kenneth and Carrel Patricia
Home Financials for this Owner
Home Financials are based on the most recent Mortgage that was taken out on this home.
Original Mortgage
$19,600
Interest Rate
7.5%
Mortgage Type
Seller Take Back
Purchase Details
Closed on
Apr 1, 1992
Create a Home Valuation Report for This Property
The Home Valuation Report is an in-depth analysis detailing your home's value as well as a comparison with similar homes in the area
Home Values in the Area
Average Home Value in this Area
Purchase History
| Date | Buyer | Sale Price | Title Company |
|---|---|---|---|
| Neal Joshuwa A | $35,000 | None Available | |
| Frasik Family Llc | $5,000 | Attorney | |
| Heath Robert | $4,200 | None Available | |
| Stonecrest Income & Opportunity Fund I L | -- | None Available | |
| Paramount Holding Llc | -- | Fidelity | |
| Deutsche Bank National Trust Company | $26,400 | None Available | |
| Sexton Bill G | $30,000 | None Available | |
| Bowlin Donald E | $30,000 | -- | |
| Carrel Kenneth | $20,000 | -- | |
| -- | $13,500 | -- |
Source: Public Records
Mortgage History
| Date | Status | Borrower | Loan Amount |
|---|---|---|---|
| Open | Neal Joshuwa A | $35,000 | |
| Previous Owner | Sexton Bill G | $63,750 | |
| Previous Owner | Bowlin Donald E | $29,000 | |
| Previous Owner | Carrel Kenneth | $19,600 |
Source: Public Records
Tax History
| Year | Tax Paid | Tax Assessment Tax Assessment Total Assessment is a certain percentage of the fair market value that is determined by local assessors to be the total taxable value of land and additions on the property. | Land | Improvement |
|---|---|---|---|---|
| 2025 | $1,251 | $21,940 | $3,190 | $18,750 |
| 2024 | $1,251 | $21,940 | $3,190 | $18,750 |
| 2023 | $1,215 | $21,940 | $3,190 | $18,750 |
| 2022 | $900 | $14,110 | $3,190 | $10,920 |
| 2021 | $869 | $14,110 | $3,190 | $10,920 |
| 2020 | $903 | $14,110 | $3,190 | $10,920 |
| 2019 | $953 | $13,150 | $3,120 | $10,030 |
| 2018 | $911 | $13,150 | $3,120 | $10,030 |
| 2017 | $913 | $13,150 | $3,120 | $10,030 |
| 2016 | $815 | $11,150 | $3,120 | $8,030 |
| 2015 | $744 | $11,150 | $3,120 | $8,030 |
| 2014 | $626 | $11,150 | $3,120 | $8,030 |
| 2013 | $626 | $8,750 | $2,710 | $6,040 |
Source: Public Records
Map
Nearby Homes
- 308 Yankee Rd
- 908 5th Ave
- 224 Yankee Rd
- 307 Curtis St
- 712 Poplar St
- 50 S Main St
- 522 Young St
- 1321 1st Ave
- 404 Baltimore St
- 215 Baltimore St
- 721 11th Ave
- 214 Garfield St
- 500 Garfield St
- 0 Middletown Eaton Rd Unit 952258
- 0 Middletown Eaton Rd Unit 1868870
- 15 Garfield St
- 801 14th Ave
- 709 14th Ave
- 704 14th Ave
- 1306 Michigan Ave
Your Personal Tour Guide
Ask me questions while you tour the home.