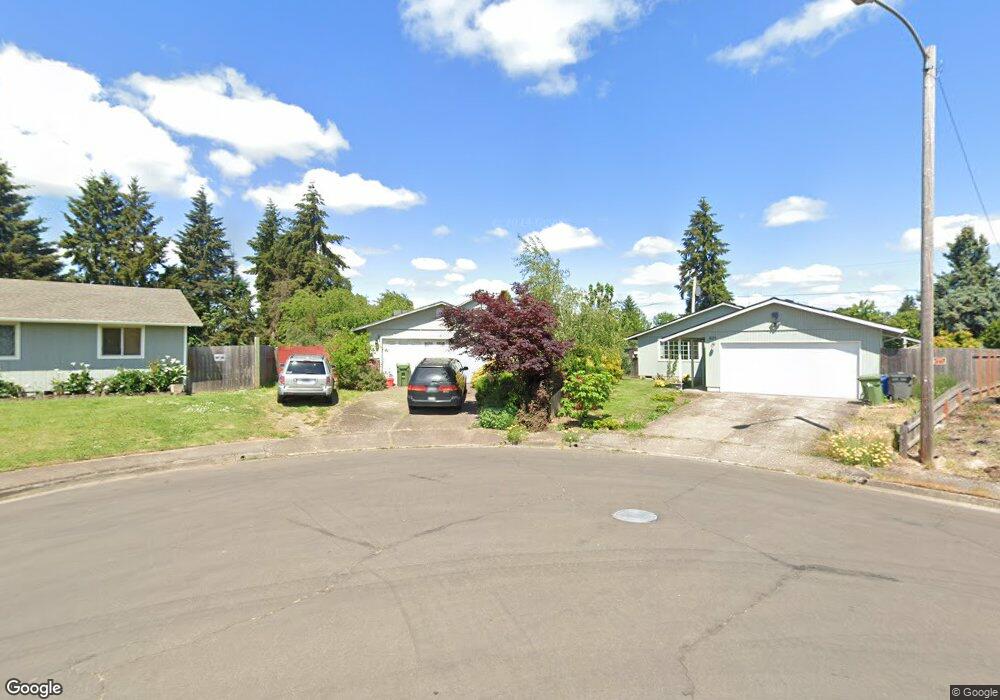
4090 Banner St Eugene, OR 97404
Santa Clara NeighborhoodEstimated Value: $457,000 - $547,000
5
Beds
2
Baths
1,901
Sq Ft
$269/Sq Ft
Est. Value
About This Home
This home is located at 4090 Banner St, Eugene, OR 97404 and is currently estimated at $511,871, approximately $269 per square foot. 4090 Banner St is a home located in Lane County with nearby schools including Awbrey Park Elementary School, Madison Middle School, and North Eugene High School.
Ownership History
Date
Name
Owned For
Owner Type
Purchase Details
Closed on
Aug 20, 2021
Sold by
Quine Shawn D
Bought by
Quine Shawn D and Bozaan Rachel E
Current Estimated Value
Purchase Details
Closed on
Feb 26, 2015
Sold by
Donahue Holly R and Robertson Holly R
Bought by
Quine Shawn D
Home Financials for this Owner
Home Financials are based on the most recent Mortgage that was taken out on this home.
Original Mortgage
$4,950
Outstanding Balance
$1,599
Interest Rate
2.93%
Mortgage Type
Stand Alone Second
Estimated Equity
$510,272
Purchase Details
Closed on
Apr 20, 2006
Sold by
Rodriguez Raul
Bought by
Robertson Holly R
Home Financials for this Owner
Home Financials are based on the most recent Mortgage that was taken out on this home.
Original Mortgage
$49,300
Interest Rate
5.98%
Mortgage Type
Stand Alone Second
Purchase Details
Closed on
Mar 10, 2003
Sold by
Triple H Partnership
Bought by
Rodriguez Raul
Home Financials for this Owner
Home Financials are based on the most recent Mortgage that was taken out on this home.
Original Mortgage
$112,100
Interest Rate
5.83%
Create a Home Valuation Report for This Property
The Home Valuation Report is an in-depth analysis detailing your home's value as well as a comparison with similar homes in the area
Home Values in the Area
Average Home Value in this Area
Purchase History
| Date | Buyer | Sale Price | Title Company |
|---|---|---|---|
| Quine Shawn D | -- | None Available | |
| Quine Shawn D | $165,000 | Western Title & Escrow Co | |
| Robertson Holly R | $246,500 | Western Title & Escrow Compa | |
| Rodriguez Raul | $118,000 | Western Title & Escrow Compa |
Source: Public Records
Mortgage History
| Date | Status | Borrower | Loan Amount |
|---|---|---|---|
| Open | Quine Shawn D | $4,950 | |
| Open | Quine Shawn D | $162,011 | |
| Previous Owner | Robertson Holly R | $49,300 | |
| Previous Owner | Robertson Holly R | $197,200 | |
| Previous Owner | Rodriguez Raul | $112,100 |
Source: Public Records
Tax History
| Year | Tax Paid | Tax Assessment Tax Assessment Total Assessment is a certain percentage of the fair market value that is determined by local assessors to be the total taxable value of land and additions on the property. | Land | Improvement |
|---|---|---|---|---|
| 2025 | $3,419 | $267,183 | -- | -- |
| 2024 | $3,402 | $259,401 | -- | -- |
| 2023 | $3,328 | $251,846 | $0 | $0 |
| 2022 | $3,197 | $244,511 | $0 | $0 |
| 2021 | $2,934 | $237,390 | $0 | $0 |
| 2020 | $2,989 | $230,476 | $0 | $0 |
| 2019 | $2,878 | $223,764 | $0 | $0 |
| 2018 | $2,650 | $210,919 | $0 | $0 |
| 2017 | $2,546 | $210,919 | $0 | $0 |
| 2016 | $2,404 | $204,776 | $0 | $0 |
| 2015 | $2,285 | $198,812 | $0 | $0 |
| 2014 | $2,146 | $193,021 | $0 | $0 |
Source: Public Records
Map
Nearby Homes
- 514 Warrington Ave
- 528 Nottingham Ave
- 355 River Loop 2
- 556 Cinderella Loop
- 329 Dean Ave
- 4483 Thunderbird St
- 3910 Andover St
- 4471 Spring Meadow Ave
- 3708 Kirsten St
- 850 E Beacon Dr
- 4366 Berry Ln
- 47 van Fossen Ct
- 110 Calumet Ave
- 4795 Thunderbird St
- 2011 River Loop 1
- 4490 Doyle St
- 212 Chimney Rock Ln
- 90 Daniel Dr
- 591 Argon Ave
- 3352 Zane Ln
- 601 Banover St
- 4070 Banner St
- 562 Warrington Ave
- 548 Warrington Ave
- 576 Warrington Ave
- 615 Banover St
- 532 Warrington Ave
- 4115 Scenic Dr
- 590 Warrington Ave
- 516 Warrington Ave
- 4111 Scenic Dr
- 4050 Banner St
- 602 Warrington Ave
- 526 Warrington Ave
- 629 Banover St
- 4105 Scenic Dr
- 553 Warrington Ave
- 567 Warrington Ave
- 640 Banover St
- 539 Warrington Ave
Your Personal Tour Guide
Ask me questions while you tour the home.