4095 W 700 S Topeka, IN 46571
Estimated Value: $420,000 - $809,912
6
Beds
3
Baths
3,464
Sq Ft
$192/Sq Ft
Est. Value
About This Home
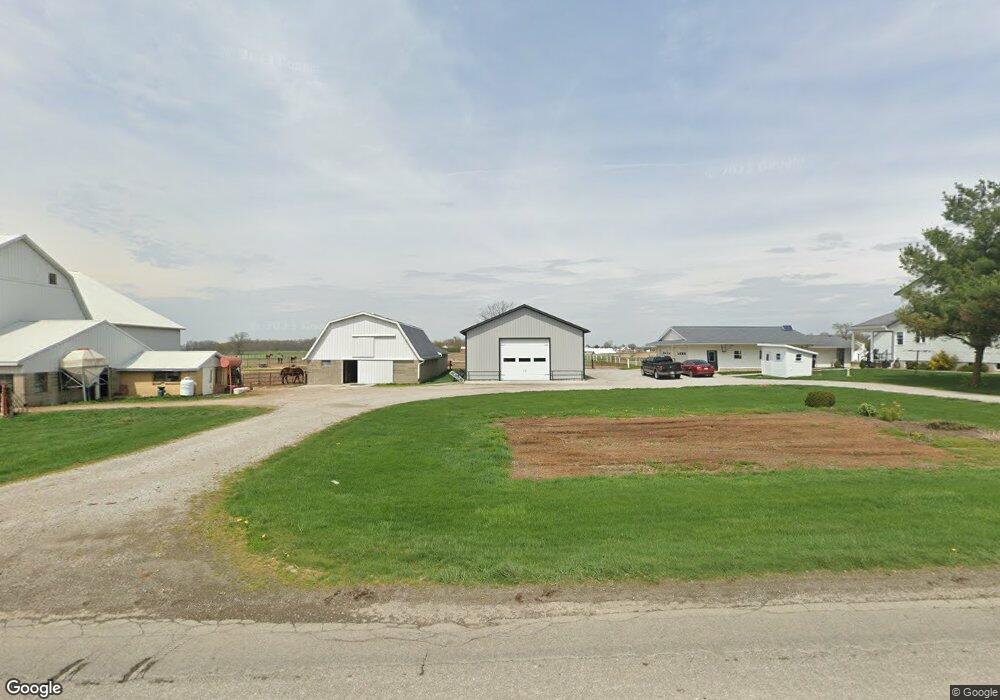
This home is located at 4095 W 700 S, Topeka, IN 46571 and is currently estimated at $666,637, approximately $192 per square foot. 4095 W 700 S is a home located in LaGrange County with nearby schools including Topeka Elementary School, Westview Elementary School, and Westview Junior/Senior High School.
Ownership History
Date
Name
Owned For
Owner Type
Purchase Details
Closed on
Sep 26, 2025
Sold by
Richard F And Rachel N Fry Family Trust and Fry Richard F
Bought by
Yoder Daniel A and Yoder Ruby F
Current Estimated Value
Home Financials for this Owner
Home Financials are based on the most recent Mortgage that was taken out on this home.
Original Mortgage
$1,052,422
Outstanding Balance
$1,052,422
Interest Rate
6.7%
Mortgage Type
New Conventional
Estimated Equity
-$385,785
Purchase Details
Closed on
Oct 13, 2017
Sold by
Fry Richard F and Fry Rachel
Bought by
Fry Richard F and Fry Rachel
Home Financials for this Owner
Home Financials are based on the most recent Mortgage that was taken out on this home.
Original Mortgage
$34,000
Interest Rate
3.94%
Mortgage Type
New Conventional
Create a Home Valuation Report for This Property
The Home Valuation Report is an in-depth analysis detailing your home's value as well as a comparison with similar homes in the area
Home Values in the Area
Average Home Value in this Area
Purchase History
| Date | Buyer | Sale Price | Title Company |
|---|---|---|---|
| Yoder Daniel A | -- | None Listed On Document | |
| Richard F And Rachel N Fry Family Trust | -- | None Listed On Document | |
| Fry Richard F | -- | Attorney Only |
Source: Public Records
Mortgage History
| Date | Status | Borrower | Loan Amount |
|---|---|---|---|
| Open | Yoder Daniel A | $1,052,422 | |
| Previous Owner | Fry Richard F | $34,000 | |
| Closed | Fry Richard F | $36,000 |
Source: Public Records
Tax History Compared to Growth
Tax History
| Year | Tax Paid | Tax Assessment Tax Assessment Total Assessment is a certain percentage of the fair market value that is determined by local assessors to be the total taxable value of land and additions on the property. | Land | Improvement |
|---|---|---|---|---|
| 2024 | $5,893 | $661,200 | $114,200 | $547,000 |
| 2023 | $6,025 | $639,900 | $101,000 | $538,900 |
| 2022 | $4,660 | $597,600 | $83,600 | $514,000 |
| 2021 | $3,924 | $490,100 | $84,800 | $405,300 |
| 2020 | $3,916 | $481,000 | $84,500 | $396,500 |
| 2019 | $4,019 | $490,200 | $93,400 | $396,800 |
| 2018 | $4,119 | $489,900 | $95,000 | $394,900 |
| 2017 | $4,057 | $503,200 | $102,600 | $400,600 |
| 2016 | $2,867 | $374,500 | $102,000 | $272,500 |
| 2014 | $2,650 | $313,200 | $111,000 | $202,200 |
| 2013 | $2,650 | $306,100 | $101,700 | $204,400 |
Source: Public Records
Map
Nearby Homes