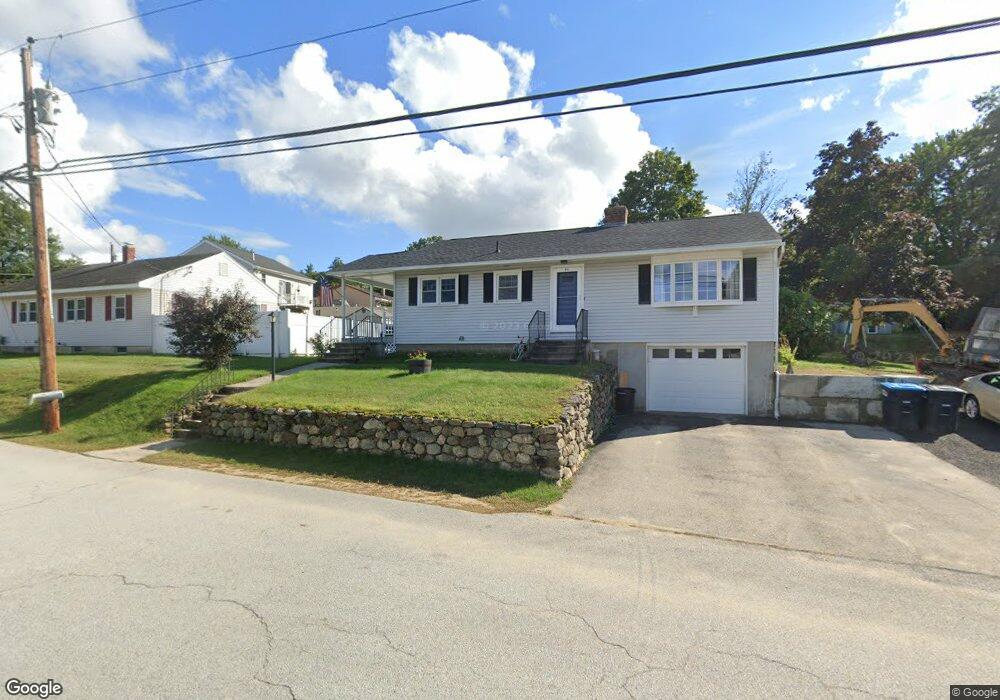
41 Als Ave Allenstown, NH 03275
Suncook NeighborhoodEstimated Value: $360,000 - $392,032
2
Beds
2
Baths
1,474
Sq Ft
$254/Sq Ft
Est. Value
About This Home
This home is located at 41 Als Ave, Allenstown, NH 03275 and is currently estimated at $374,758, approximately $254 per square foot. 41 Als Ave is a home located in Merrimack County with nearby schools including Allenstown Elementary School, Armand R. Dupont School, and Tender Years Child Care & Learning Center.
Ownership History
Date
Name
Owned For
Owner Type
Purchase Details
Closed on
Aug 11, 2023
Sold by
W A
Bought by
Frost Miah R and Frost Richard S
Current Estimated Value
Home Financials for this Owner
Home Financials are based on the most recent Mortgage that was taken out on this home.
Original Mortgage
$320,095
Outstanding Balance
$312,664
Interest Rate
6.71%
Mortgage Type
FHA
Estimated Equity
$62,094
Purchase Details
Closed on
Sep 5, 2017
Sold by
Poirier Armand W and Poirier Ruth D
Bought by
Armand W Poirier T W and Armand Poirier
Create a Home Valuation Report for This Property
The Home Valuation Report is an in-depth analysis detailing your home's value as well as a comparison with similar homes in the area
Home Values in the Area
Average Home Value in this Area
Purchase History
| Date | Buyer | Sale Price | Title Company |
|---|---|---|---|
| Frost Miah R | $326,000 | None Available | |
| Armand W Poirier T W | -- | -- |
Source: Public Records
Mortgage History
| Date | Status | Borrower | Loan Amount |
|---|---|---|---|
| Open | Frost Miah R | $320,095 |
Source: Public Records
Tax History Compared to Growth
Tax History
| Year | Tax Paid | Tax Assessment Tax Assessment Total Assessment is a certain percentage of the fair market value that is determined by local assessors to be the total taxable value of land and additions on the property. | Land | Improvement |
|---|---|---|---|---|
| 2024 | $7,718 | $303,600 | $130,800 | $172,800 |
| 2023 | $6,436 | $303,600 | $130,800 | $172,800 |
| 2022 | $5,920 | $303,600 | $130,800 | $172,800 |
| 2021 | $5,720 | $181,600 | $78,500 | $103,100 |
| 2020 | $5,321 | $181,600 | $78,500 | $103,100 |
| 2019 | $5,648 | $181,600 | $78,500 | $103,100 |
| 2018 | $5,475 | $181,600 | $78,500 | $103,100 |
| 2017 | $5,831 | $181,600 | $78,500 | $103,100 |
| 2016 | $5,052 | $149,200 | $57,100 | $92,100 |
| 2015 | $4,898 | $149,200 | $57,100 | $92,100 |
| 2014 | $5,040 | $149,200 | $57,100 | $92,100 |
| 2013 | $4,717 | $149,600 | $57,100 | $92,500 |
Source: Public Records
Map
Nearby Homes
- 422 Dawn Dr Unit 23
- 427 Dawn Dr Unit 15
- 15 Main St
- 4 Rodger Rd
- 7 Ferry St
- 111 Glass St
- 1 1/2 Bartlett St
- 100 Main St Unit M10
- 100 Main St Unit 204
- 12-14 Church St Unit 12,14
- 19 Sullivan Dr
- 10 Lane Dr
- 2 Cheryl Dr
- 15 Sullivan Dr
- 1821 Hooksett Rd
- 233 Pembroke St
- 307 Dearborn Rd
- 259 Pembroke St
- 14 Manor Dr Unit D
- 12 Manor Dr Unit B