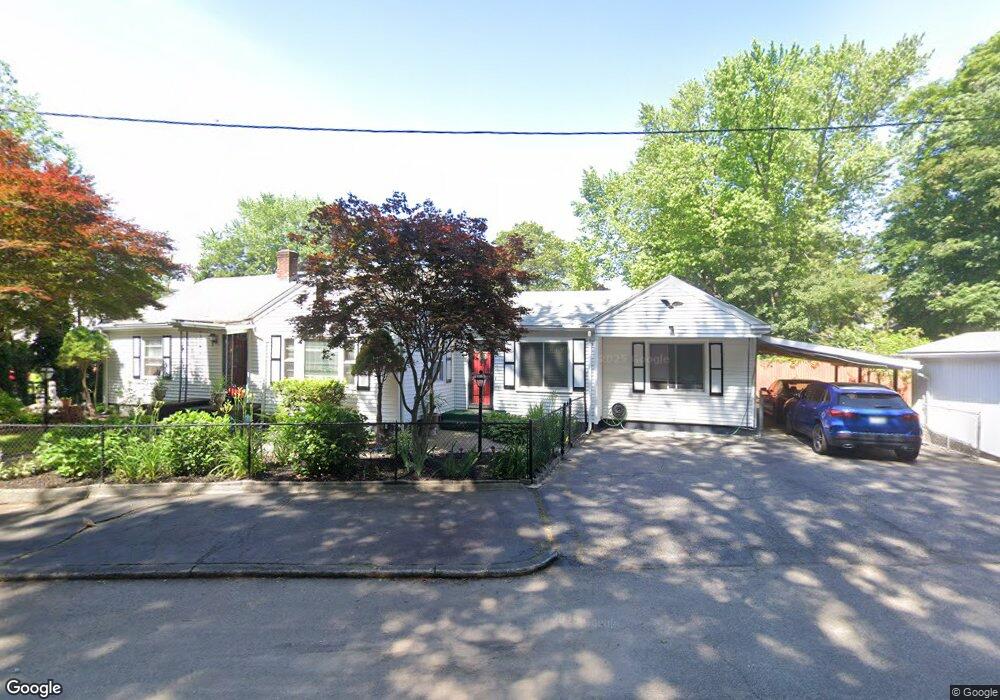
41 Central St Cranston, RI 02905
Edgewood NeighborhoodEstimated Value: $432,000 - $511,000
3
Beds
2
Baths
2,125
Sq Ft
$220/Sq Ft
Est. Value
About This Home
This home is located at 41 Central St, Cranston, RI 02905 and is currently estimated at $467,715, approximately $220 per square foot. 41 Central St is a home located in Providence County with nearby schools including Edgewood Highland Elementary School, Park View Middle School, and Cranston High School East.
Ownership History
Date
Name
Owned For
Owner Type
Purchase Details
Closed on
Nov 4, 2024
Sold by
Ventura Shadil R and Ventura Hansel Y
Bought by
Perez Maritza and Ventura Rafael A
Current Estimated Value
Purchase Details
Closed on
Sep 30, 2024
Sold by
Ventura Shadil and Ventura Shansel
Bought by
Ventura Shadil R and Ventura Hansel Y
Purchase Details
Closed on
Sep 14, 2022
Sold by
Perez Maritza and Ventura Rafael A
Bought by
Ventura Shadil R and Ventura Hansel Y
Create a Home Valuation Report for This Property
The Home Valuation Report is an in-depth analysis detailing your home's value as well as a comparison with similar homes in the area
Home Values in the Area
Average Home Value in this Area
Purchase History
| Date | Buyer | Sale Price | Title Company |
|---|---|---|---|
| Perez Maritza | -- | None Available | |
| Perez Maritza | -- | None Available | |
| Ventura Shadil R | -- | None Available | |
| Ventura Shadil R | -- | None Available | |
| Ventura Shadil R | -- | None Available | |
| Ventura Shadil R | -- | None Available |
Source: Public Records
Tax History
| Year | Tax Paid | Tax Assessment Tax Assessment Total Assessment is a certain percentage of the fair market value that is determined by local assessors to be the total taxable value of land and additions on the property. | Land | Improvement |
|---|---|---|---|---|
| 2025 | $4,920 | $354,500 | $110,100 | $244,400 |
| 2024 | $4,825 | $354,500 | $110,100 | $244,400 |
| 2023 | $4,602 | $243,500 | $72,500 | $171,000 |
| 2022 | $4,507 | $243,500 | $72,500 | $171,000 |
| 2021 | $4,383 | $243,500 | $72,500 | $171,000 |
| 2020 | $4,135 | $199,100 | $69,000 | $130,100 |
| 2019 | $4,135 | $199,100 | $69,000 | $130,100 |
| 2018 | $4,040 | $199,100 | $69,000 | $130,100 |
| 2017 | $4,106 | $179,000 | $62,100 | $116,900 |
| 2016 | $4,019 | $179,000 | $62,100 | $116,900 |
| 2015 | $4,019 | $179,000 | $62,100 | $116,900 |
| 2014 | $3,938 | $172,400 | $62,100 | $110,300 |
Source: Public Records
Map
Nearby Homes
- 166 Narragansett St
- 220 Bay View Ave
- 243 Bay View Ave
- 325 Northup St
- 175 Montgomery Ave
- 358 Northup St
- 147 Wentworth Ave
- 61 Armington St
- 274 Montgomery Ave
- 232 Massachusetts Ave
- 273 Montgomery Ave
- 1180 Narragansett Blvd Unit 1
- 208 California Ave
- 233 California Ave
- 180 Ohio Ave
- 160 Ohio Ave
- 390 Montgomery Ave
- 255 Ohio Ave
- 1445 Broad St
- 61 Cyr St
Your Personal Tour Guide
Ask me questions while you tour the home.