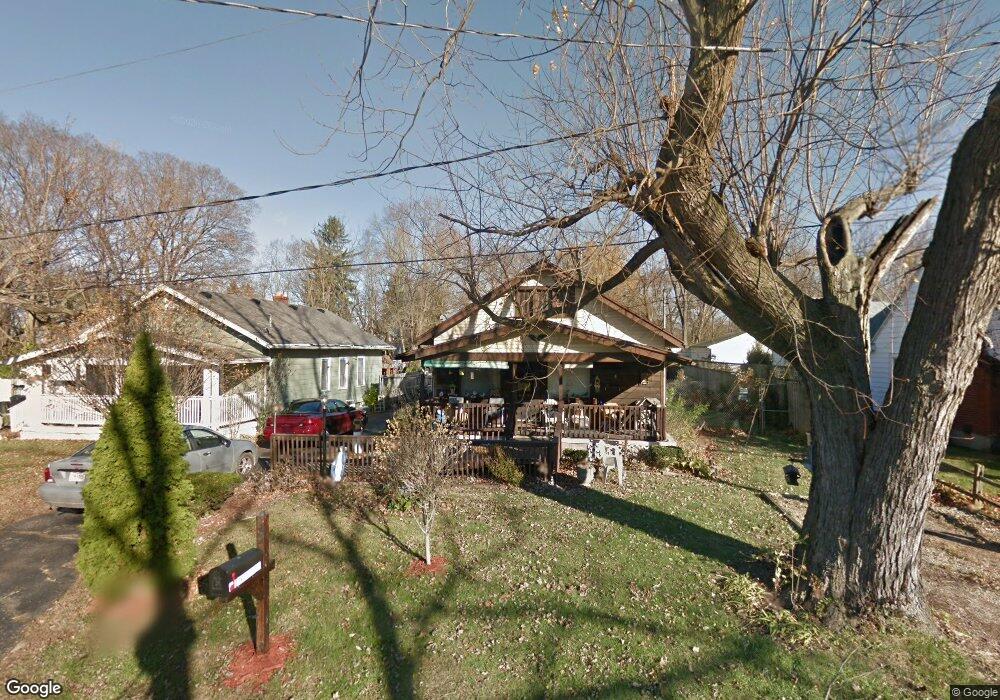
41 Ingleside Ave Dayton, OH 45404
Avondale NeighborhoodEstimated Value: $67,000 - $160,000
3
Beds
1
Bath
1,061
Sq Ft
$111/Sq Ft
Est. Value
About This Home
This home is located at 41 Ingleside Ave, Dayton, OH 45404 and is currently estimated at $117,689, approximately $110 per square foot. 41 Ingleside Ave is a home located in Montgomery County with nearby schools including Stebbins High School, Pathway School of Discovery, and Liberty High School.
Ownership History
Date
Name
Owned For
Owner Type
Purchase Details
Closed on
Jan 4, 2024
Sold by
Bottom To The Top Inv Llc
Bought by
Blue Line Capital Llc
Current Estimated Value
Home Financials for this Owner
Home Financials are based on the most recent Mortgage that was taken out on this home.
Original Mortgage
$434,250
Outstanding Balance
$427,126
Interest Rate
7.29%
Mortgage Type
New Conventional
Estimated Equity
-$309,437
Purchase Details
Closed on
Mar 28, 2023
Sold by
Horst Barbara Ann
Bought by
Bottom To The Top Inv Llc
Purchase Details
Closed on
Jul 22, 2013
Sold by
Brewer Barbara Ann
Bought by
Horst Barbara Ann
Purchase Details
Closed on
Mar 17, 2006
Sold by
Gray Virginia H
Bought by
Horst John R and Brewer Barbara
Purchase Details
Closed on
Jun 23, 1998
Sold by
Armstrong Richard W and Gray Virginia H
Bought by
Gray Virginia H
Create a Home Valuation Report for This Property
The Home Valuation Report is an in-depth analysis detailing your home's value as well as a comparison with similar homes in the area
Home Values in the Area
Average Home Value in this Area
Purchase History
| Date | Buyer | Sale Price | Title Company |
|---|---|---|---|
| Blue Line Capital Llc | -- | Columbus Title | |
| Bottom To The Top Inv Llc | $35,000 | None Listed On Document | |
| Horst Barbara Ann | -- | None Available | |
| Horst John R | -- | None Available | |
| Gray Virginia H | $50,000 | -- | |
| Gray Virginia H | $50,000 | -- |
Source: Public Records
Mortgage History
| Date | Status | Borrower | Loan Amount |
|---|---|---|---|
| Open | Blue Line Capital Llc | $434,250 |
Source: Public Records
Tax History Compared to Growth
Tax History
| Year | Tax Paid | Tax Assessment Tax Assessment Total Assessment is a certain percentage of the fair market value that is determined by local assessors to be the total taxable value of land and additions on the property. | Land | Improvement |
|---|---|---|---|---|
| 2024 | $3,695 | $24,080 | $4,490 | $19,590 |
| 2023 | $3,695 | $24,080 | $4,490 | $19,590 |
| 2022 | $1,232 | $19,260 | $3,590 | $15,670 |
| 2021 | $1,256 | $19,260 | $3,590 | $15,670 |
| 2020 | $1,256 | $19,260 | $3,590 | $15,670 |
| 2019 | $1,309 | $17,930 | $3,230 | $14,700 |
| 2018 | $1,312 | $17,930 | $3,230 | $14,700 |
| 2017 | $1,311 | $17,930 | $3,230 | $14,700 |
| 2016 | $1,295 | $17,180 | $3,590 | $13,590 |
| 2015 | $1,430 | $17,180 | $3,590 | $13,590 |
| 2014 | $1,430 | $17,180 | $3,590 | $13,590 |
| 2012 | -- | $21,300 | $3,590 | $17,710 |
Source: Public Records
Map
Nearby Homes
- 34 Ingleside Ave
- 241 Community Dr
- 641 Prince Albert Blvd
- 1930 Brandt Pike
- 3586 Lane Garden Ct
- 518 Tyron Ave
- - Prince Albert Blvd
- -- Prince Albert Blvd
- 546 Wynora Ave
- 535 Reading Rd
- 620 Homecrest Ave
- 512 Reading Rd
- 508 Reading Rd
- - Rondowa Ave
- -- Rondowa Ave
- 2460 Bushnell Ave
- 2249 Prince Albert Blvd
- 634 Mentor Ave
- 2249 Valley Pike
- 2245 Valley Pike
- 47 Ingleside Ave
- 37 Ingleside Ave
- 105 Ingleside Ave
- 46 Ingleside Ave
- 42 Ingleside Ave
- 38 Ingleside Ave
- 107 Ingleside Ave
- 3140 Old Troy Pike
- 104 Ingleside Ave
- 30 Ingleside Ave
- 109 Ingleside Ave
- 106 Ingleside Ave
- 18 Ingleside Ave
- 3100 Old Troy Pike
- 21 Community Dr
- 112 Ingleside Ave
- 17 Community Dr
- 13 Community Dr
- 101 Community Dr
- 10 Ingleside Ave