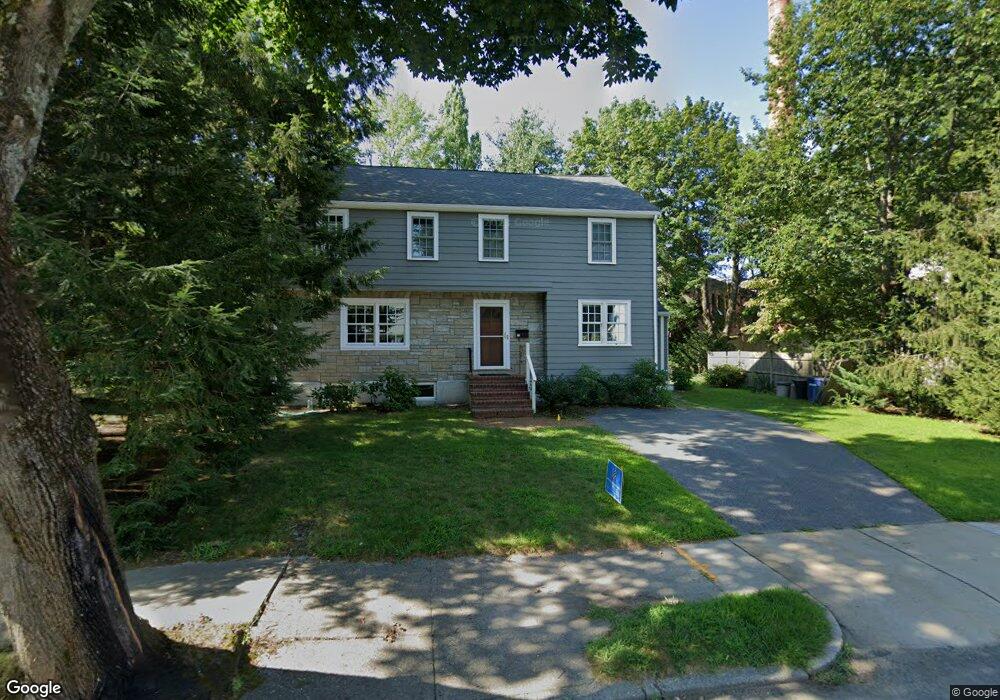
41 Longfellow Rd Newton Lower Falls, MA 02462
Waban NeighborhoodEstimated Value: $1,433,000 - $1,658,000
4
Beds
3
Baths
2,312
Sq Ft
$682/Sq Ft
Est. Value
About This Home
This home is located at 41 Longfellow Rd, Newton Lower Falls, MA 02462 and is currently estimated at $1,576,249, approximately $681 per square foot. 41 Longfellow Rd is a home located in Middlesex County with nearby schools including Angier Elementary School, Charles E Brown Middle School, and Newton South High School.
Ownership History
Date
Name
Owned For
Owner Type
Purchase Details
Closed on
May 8, 2018
Sold by
Flynn Jay W and Niles Barbara L
Bought by
Flynn & Niles Rt
Current Estimated Value
Purchase Details
Closed on
Mar 1, 2010
Sold by
Niles Tr Barbara L and Flynn Jay W
Bought by
Niles Barbara L and Flynn Jay W
Purchase Details
Closed on
Apr 21, 2004
Sold by
Niles Barbara L and Flynn Jay W
Bought by
Flynn Miles Rt and Niles Barbara L
Purchase Details
Closed on
Mar 29, 1999
Sold by
Eberhart Andrew W and Eberhart Gretchen P
Bought by
Niles Barbara L and Flynn Jay M
Purchase Details
Closed on
Aug 4, 1995
Sold by
Ribitzky Ron and Ribitzky Dafna T
Bought by
Eberhart Andrew W and Eberhart Gretchen P
Purchase Details
Closed on
Mar 18, 1988
Sold by
Lewenberg Selma K
Bought by
Ribitzky Ron
Create a Home Valuation Report for This Property
The Home Valuation Report is an in-depth analysis detailing your home's value as well as a comparison with similar homes in the area
Home Values in the Area
Average Home Value in this Area
Purchase History
| Date | Buyer | Sale Price | Title Company |
|---|---|---|---|
| Flynn & Niles Rt | -- | -- | |
| Niles Barbara L | -- | -- | |
| Flynn Miles Rt | -- | -- | |
| Niles Barbara L | -- | -- | |
| Niles Barbara L | $384,500 | -- | |
| Eberhart Andrew W | $280,000 | -- | |
| Ribitzky Ron | $250,000 | -- |
Source: Public Records
Mortgage History
| Date | Status | Borrower | Loan Amount |
|---|---|---|---|
| Previous Owner | Ribitzky Ron | $414,000 | |
| Previous Owner | Ribitzky Ron | $417,000 | |
| Previous Owner | Ribitzky Ron | $249,000 |
Source: Public Records
Tax History Compared to Growth
Tax History
| Year | Tax Paid | Tax Assessment Tax Assessment Total Assessment is a certain percentage of the fair market value that is determined by local assessors to be the total taxable value of land and additions on the property. | Land | Improvement |
|---|---|---|---|---|
| 2025 | $13,445 | $1,371,900 | $821,500 | $550,400 |
| 2024 | $12,999 | $1,331,900 | $797,600 | $534,300 |
| 2023 | $12,295 | $1,207,800 | $614,600 | $593,200 |
| 2022 | $11,765 | $1,118,300 | $569,100 | $549,200 |
| 2021 | $11,352 | $1,055,000 | $536,900 | $518,100 |
| 2020 | $11,014 | $1,055,000 | $536,900 | $518,100 |
| 2019 | $10,704 | $1,024,300 | $521,300 | $503,000 |
| 2018 | $10,081 | $931,700 | $469,600 | $462,100 |
| 2017 | $9,774 | $879,000 | $443,000 | $436,000 |
| 2016 | $9,349 | $821,500 | $414,000 | $407,500 |
| 2015 | $8,914 | $767,800 | $386,900 | $380,900 |
Source: Public Records
Map
Nearby Homes
- 10 Lorraine Cir
- 2084 Washington St
- 33 Metacomet Rd
- 1801 Beacon St
- 34 Palmer Rd
- 45 E Quinobequin Rd
- 1754 Washington St
- 177 Varick Rd
- 283 Woodland Rd
- 1640 Commonwealth Ave
- 45 Moulton St
- 115 Windsor Rd
- 17 Deforest Rd
- 20 Kinmonth Rd Unit 203
- 20 Kinmonth Rd Unit 306
- 34 Pilgrim Rd
- 17 Lasell St
- 27 Oakwood Rd
- 1639 Washington St
- 18 Annawan Rd
- 51 Longfellow Rd
- 33 Longfellow Rd
- 44 Longfellow Rd
- 38 Longfellow Rd
- 54 Longfellow Rd
- 59 Longfellow Rd
- 25 Longfellow Rd
- 30 Longfellow Rd
- 30 Longfellow Rd Unit 30
- 30 Longfellow Rd Unit B
- 64 Longfellow Rd
- 65 Longfellow Rd
- 17 Longfellow Rd
- 22 Longfellow Rd
- 70 Longfellow Rd
- 69 Longfellow Rd
- 1946 Washington St Unit 35
- 1946 Washington St
- 79 Longfellow Rd
- 9 Longfellow Rd