Estimated Value: $254,000 - $272,258
3
Beds
2
Baths
1,535
Sq Ft
$170/Sq Ft
Est. Value
About This Home
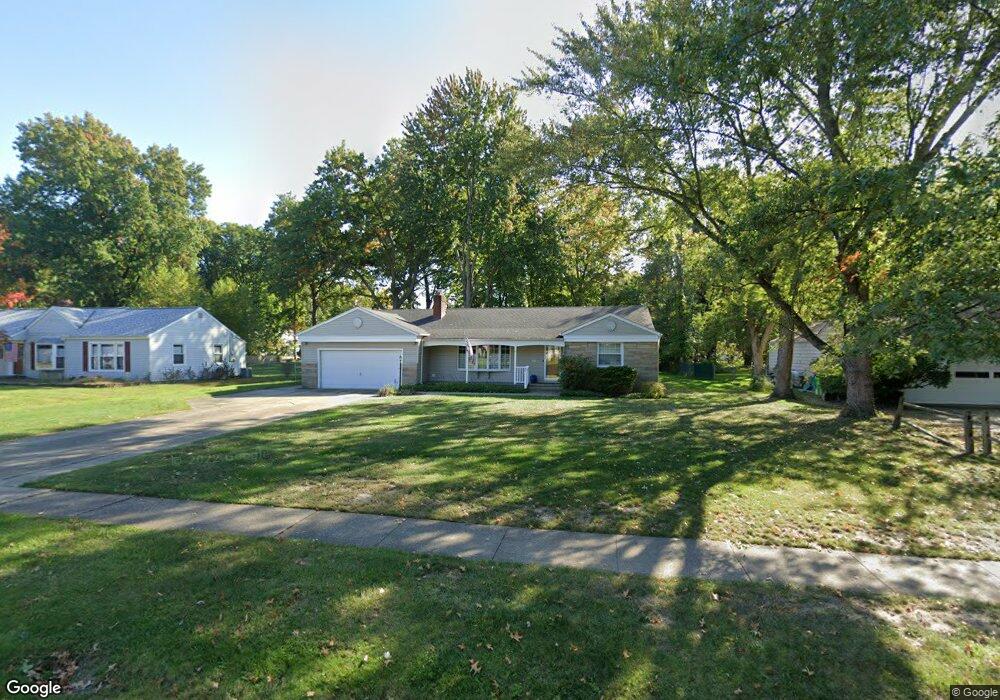
This home is located at 41 Manning Dr, Berea, OH 44017 and is currently estimated at $261,315, approximately $170 per square foot. 41 Manning Dr is a home located in Cuyahoga County with nearby schools including Grindstone Elementary School, Berea-Midpark Middle School, and Berea-Midpark High School.
Ownership History
Date
Name
Owned For
Owner Type
Purchase Details
Closed on
Feb 18, 2019
Sold by
Monchak Steve D and Monchak Mary C
Bought by
Monchak Irrevocable Heritage Trust and Bonner
Current Estimated Value
Purchase Details
Closed on
Sep 4, 2015
Sold by
Monchak Steve D and Monchak Mary C
Bought by
Monchak Steve D and Monchak Mary C
Purchase Details
Closed on
Sep 3, 1992
Sold by
Monchak Steven D
Bought by
Monchak Steve D
Purchase Details
Closed on
Feb 13, 1987
Sold by
Joan M Ziegelmayer
Bought by
Monchak Steven D
Purchase Details
Closed on
Apr 25, 1979
Sold by
Ziegelmayer Louis and Ziegelmayer Joan M
Bought by
Joan M Ziegelmayer
Purchase Details
Closed on
Jun 22, 1977
Sold by
Isabell Joseph L
Bought by
Ziegelmayer Louis and Ziegelmayer Joan M
Purchase Details
Closed on
May 20, 1977
Sold by
Isabell Joseph L
Bought by
Isabell Joseph L
Purchase Details
Closed on
May 9, 1977
Sold by
Bowes Lewis H and Bowes Diana J
Bought by
Isabell Joseph L
Purchase Details
Closed on
Jan 1, 1975
Bought by
Bowes Lewis H and Bowes Diana J
Create a Home Valuation Report for This Property
The Home Valuation Report is an in-depth analysis detailing your home's value as well as a comparison with similar homes in the area
Home Values in the Area
Average Home Value in this Area
Purchase History
We collect this data history from publicly available records. To have your information removed, we recommend requesting removal directly through your county’s website.
| Date | Buyer | Sale Price | Title Company |
|---|---|---|---|
| Monchak Irrevocable Heritage Trust | -- | None Listed On Document | |
| Monchak Steve D | -- | Attorney | |
| Monchak Steve D | -- | -- | |
| Monchak Steven D | $70,000 | -- | |
| Joan M Ziegelmayer | -- | -- | |
| Ziegelmayer Louis | $49,500 | -- | |
| Isabell Joseph L | -- | -- | |
| Isabell Joseph L | -- | -- | |
| Bowes Lewis H | -- | -- |
Source: Public Records
Tax History
| Year | Tax Paid | Tax Assessment Tax Assessment Total Assessment is a certain percentage of the fair market value that is determined by local assessors to be the total taxable value of land and additions on the property. | Land | Improvement |
|---|---|---|---|---|
| 2025 | $4,259 | $83,405 | $22,295 | $61,110 |
| 2024 | $4,269 | $83,405 | $22,295 | $61,110 |
| 2023 | $3,688 | $62,370 | $18,130 | $44,240 |
| 2022 | $3,693 | $62,370 | $18,130 | $44,240 |
| 2021 | $3,660 | $62,370 | $18,130 | $44,240 |
| 2020 | $3,397 | $52,850 | $15,370 | $37,490 |
| 2019 | $3,306 | $151,000 | $43,900 | $107,100 |
| 2018 | $3,290 | $52,850 | $15,370 | $37,490 |
| 2017 | $3,313 | $49,990 | $20,410 | $29,580 |
| 2016 | $3,288 | $49,990 | $20,410 | $29,580 |
| 2015 | $3,305 | $49,990 | $20,410 | $29,580 |
| 2014 | $3,305 | $52,610 | $21,490 | $31,120 |
Source: Public Records
Map
Nearby Homes
- 165 Dorland Ave
- 8036 Fair Rd
- 9207 Prospect Rd
- 20598 Homestead Park Dr
- 262 Stanmary Dr
- 80 Hamilton St
- 11035 Steven David Dr
- 8760 Priem Rd
- 7679 S Eastland Rd
- 233 Baldwin Dr
- 8345 Celianna Dr
- 9753 Prospect Rd
- 8902 Lincolnshire Blvd
- 7640 S Eastland Rd
- 329 Baldwin Dr
- 21032 Breckenridge Ln
- 8407 Barton Dr
- 50 S Rocky River Dr Unit 705
- 9981 Woodhurst Dr
- 723 Trotter Ln
- 31 Manning Dr
- 61 Manning Dr
- 692 S Point Trail
- 693 S Point Trail Unit H31
- 691 S Point Trail Unit H32
- 690 S Point Trail
- 19 Manning Dr
- 687 S Point Trail Unit G25
- 688 S Point Trail
- 686 S Point Trail
- 689 S Point Trail
- 687 S Point Trail Unit G
- 696 S Point Trail Unit 133
- 695 S Point Trail Unit 136
- 697 S Point Trail Unit I35
- 694 S Point Trail
- 695 S Point Trail Unit I36
- 694 S Point Trail Unit I34
- 71 Manning Dr
- 42 Manning Dr
Your Personal Tour Guide
Ask me questions while you tour the home.