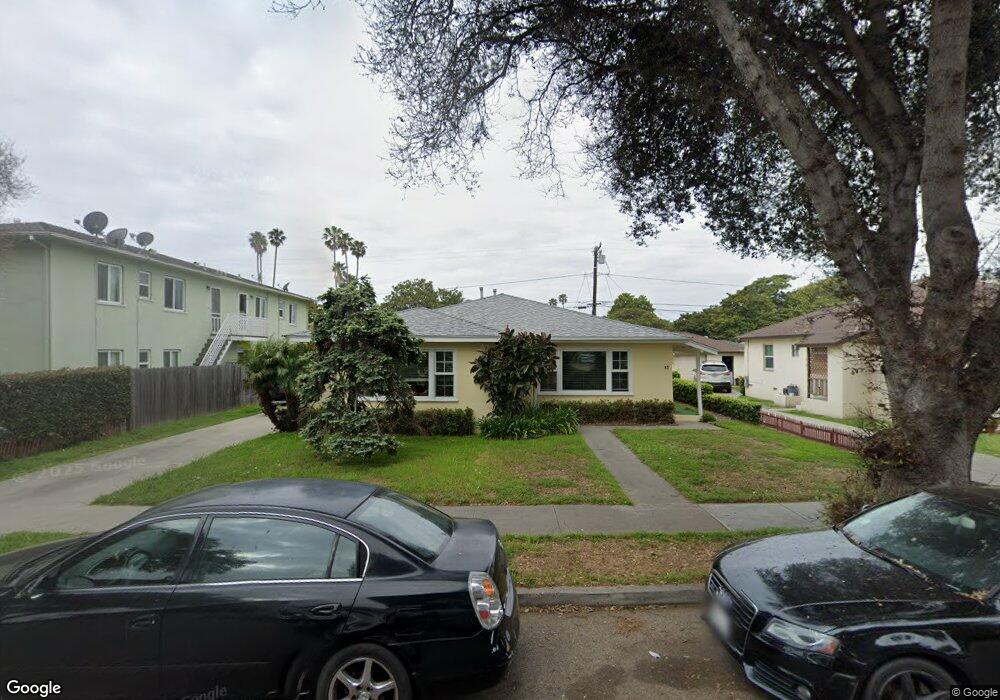
41 N Dos Caminos Ave Ventura, CA 93003
Midtown NeighborhoodEstimated Value: $868,274 - $1,111,000
--
Bed
--
Bath
1,552
Sq Ft
$664/Sq Ft
Est. Value
About This Home
This home is located at 41 N Dos Caminos Ave, Ventura, CA 93003 and is currently estimated at $1,030,569, approximately $664 per square foot. 41 N Dos Caminos Ave is a home located in Ventura County with nearby schools including Loma Vista Elementary School, Cabrillo Middle School, and Ventura High School.
Ownership History
Date
Name
Owned For
Owner Type
Purchase Details
Closed on
May 9, 2018
Sold by
Graves Joel M
Bought by
Graves Joel Nelson and The Joel Nelson Graves Revocab
Current Estimated Value
Purchase Details
Closed on
Apr 20, 2012
Sold by
Graves Heidi C
Bought by
Graves Joel N
Home Financials for this Owner
Home Financials are based on the most recent Mortgage that was taken out on this home.
Original Mortgage
$337,500
Outstanding Balance
$233,005
Interest Rate
3.9%
Mortgage Type
New Conventional
Estimated Equity
$797,564
Purchase Details
Closed on
Jan 6, 1999
Sold by
Davis Anna Mae Trust and Gerald E
Bought by
Graves Joel N and Graves Heidi C
Home Financials for this Owner
Home Financials are based on the most recent Mortgage that was taken out on this home.
Original Mortgage
$233,436
Interest Rate
6.78%
Mortgage Type
FHA
Create a Home Valuation Report for This Property
The Home Valuation Report is an in-depth analysis detailing your home's value as well as a comparison with similar homes in the area
Home Values in the Area
Average Home Value in this Area
Purchase History
| Date | Buyer | Sale Price | Title Company |
|---|---|---|---|
| Graves Joel Nelson | -- | None Available | |
| Graves Joel N | -- | Fidelity National Title Co | |
| Graves Joel N | $235,000 | -- |
Source: Public Records
Mortgage History
| Date | Status | Borrower | Loan Amount |
|---|---|---|---|
| Open | Graves Joel N | $337,500 | |
| Previous Owner | Graves Joel N | $233,436 |
Source: Public Records
Tax History Compared to Growth
Tax History
| Year | Tax Paid | Tax Assessment Tax Assessment Total Assessment is a certain percentage of the fair market value that is determined by local assessors to be the total taxable value of land and additions on the property. | Land | Improvement |
|---|---|---|---|---|
| 2025 | $3,979 | $368,379 | $250,817 | $117,562 |
| 2024 | $3,979 | $361,156 | $245,899 | $115,257 |
| 2023 | $3,931 | $354,075 | $241,077 | $112,998 |
| 2022 | $3,663 | $347,133 | $236,350 | $110,783 |
| 2021 | $3,592 | $340,327 | $231,716 | $108,611 |
| 2020 | $3,558 | $336,840 | $229,341 | $107,499 |
| 2019 | $3,492 | $330,237 | $224,845 | $105,392 |
| 2018 | $3,434 | $323,763 | $220,437 | $103,326 |
| 2017 | $3,361 | $317,415 | $216,115 | $101,300 |
| 2016 | $3,295 | $311,192 | $211,878 | $99,314 |
| 2015 | $3,260 | $306,520 | $208,697 | $97,823 |
| 2014 | $3,206 | $300,517 | $204,610 | $95,907 |
Source: Public Records
Map
Nearby Homes
- 3302 San Luis St
- 220 Frances St
- 114 San Marino Ave
- 297 Rancho Dr
- 401 S Brent St
- 3179 Porter Ln
- 431 Eva St
- 33 Glen Ellen Dr
- 344 S Evergreen Dr
- 2542 Poli St
- 3124 Grove St
- 3750 Mound Ave
- 476 Howard St
- 2418 Lexington Dr
- 561 S Brent St
- 400 Arcade Dr
- 3345 Porter Ln
- 664 Lemon Grove Ave
- 3353 Porter Ln
- 251 Palomares Ave
- 49 N Dos Caminos Ave
- 31 N Dos Caminos Ave
- 42 N Joanne Ave Unit 44
- 42 N Joanne Ave Unit 42
- 42 N Joanne Ave
- 23 N Dos Caminos Ave
- 57 N Dos Caminos Ave
- 54 N Joanne Ave
- 50 N Joanne Ave Unit 2
- 50 N Joanne Ave
- 27 N Dos Caminos Ave
- 48 N Dos Caminos Ave
- 44 N Joanne Ave Unit 44
- 44 N Joanne Ave Unit 42
- 58 N Joanne Ave
- 24 N Joanne Ave
- 60 N Dos Caminos Ave
- 42 N Dos Caminos Ave
- 50 54-48 N Dos Caminos Ave
- 50 N Dos Caminos Ave