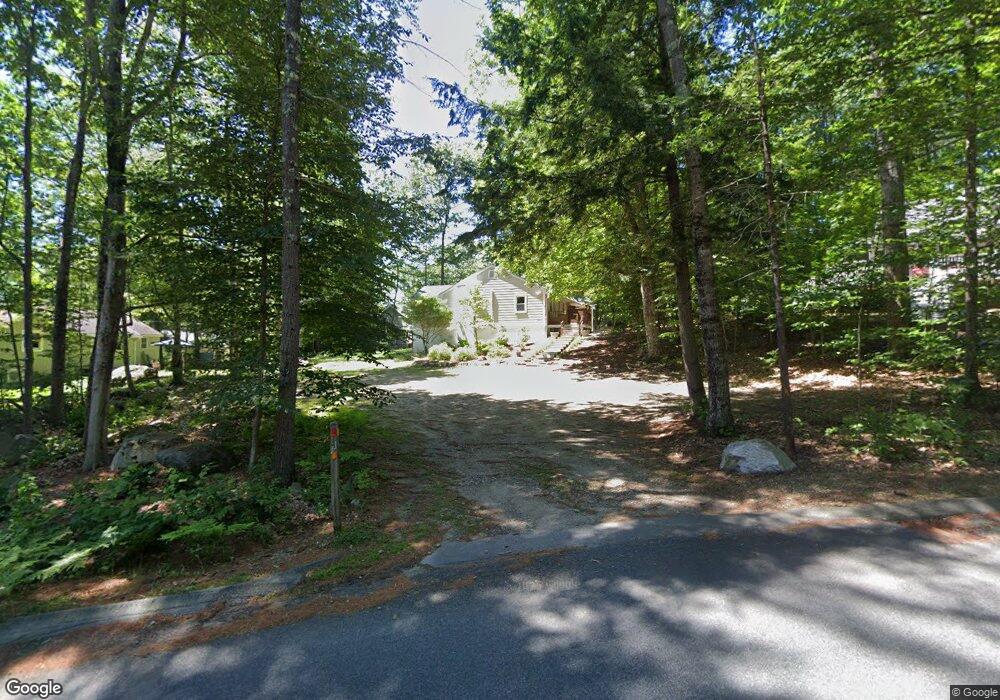
41 Old Hubbard Road and Boat Slip Meredith, NH 03253
Estimated Value: $662,785 - $985,000
2
Beds
1
Bath
762
Sq Ft
$1,008/Sq Ft
Est. Value
About This Home
This home is located at 41 Old Hubbard Road and Boat Slip, Meredith, NH 03253 and is currently estimated at $768,196, approximately $1,008 per square foot. 41 Old Hubbard Road and Boat Slip is a home located in Belknap County with nearby schools including Inter-Lakes Elementary School.
Ownership History
Date
Name
Owned For
Owner Type
Purchase Details
Closed on
Oct 27, 2020
Sold by
Brann Kelly A and Brann William J
Bought by
Downey Brian and Downey Michelle
Current Estimated Value
Home Financials for this Owner
Home Financials are based on the most recent Mortgage that was taken out on this home.
Original Mortgage
$296,000
Outstanding Balance
$263,398
Interest Rate
2.8%
Mortgage Type
New Conventional
Estimated Equity
$504,798
Purchase Details
Closed on
Jun 16, 2015
Sold by
Clark James H and Clark Elizabeth G
Bought by
Brown Kelly A and Brann William J
Home Financials for this Owner
Home Financials are based on the most recent Mortgage that was taken out on this home.
Original Mortgage
$220,400
Interest Rate
3.65%
Mortgage Type
New Conventional
Purchase Details
Closed on
Oct 7, 2005
Sold by
Crane Carleton W and Crane Gloria F
Bought by
Clark James H and Clark Elizabeth G
Create a Home Valuation Report for This Property
The Home Valuation Report is an in-depth analysis detailing your home's value as well as a comparison with similar homes in the area
Home Values in the Area
Average Home Value in this Area
Purchase History
| Date | Buyer | Sale Price | Title Company |
|---|---|---|---|
| Downey Brian | $378,000 | None Available | |
| Brown Kelly A | $275,533 | -- | |
| Clark James H | $298,500 | -- |
Source: Public Records
Mortgage History
| Date | Status | Borrower | Loan Amount |
|---|---|---|---|
| Open | Downey Brian | $296,000 | |
| Previous Owner | Clark James H | $220,400 |
Source: Public Records
Tax History Compared to Growth
Tax History
| Year | Tax Paid | Tax Assessment Tax Assessment Total Assessment is a certain percentage of the fair market value that is determined by local assessors to be the total taxable value of land and additions on the property. | Land | Improvement |
|---|---|---|---|---|
| 2024 | $5,856 | $570,800 | $440,800 | $130,000 |
| 2023 | $6,735 | $681,000 | $551,000 | $130,000 |
| 2022 | $4,968 | $355,600 | $258,400 | $97,200 |
| 2021 | $4,776 | $355,600 | $258,400 | $97,200 |
| 2020 | $4,955 | $353,400 | $258,400 | $95,000 |
| 2019 | $4,197 | $264,100 | $178,200 | $85,900 |
| 2018 | $4,125 | $264,100 | $178,200 | $85,900 |
| 2016 | $4,116 | $264,000 | $192,600 | $71,400 |
| 2015 | $4,013 | $264,000 | $192,600 | $71,400 |
| 2014 | $3,915 | $264,000 | $192,600 | $71,400 |
| 2013 | $3,786 | $262,700 | $192,600 | $70,100 |
Source: Public Records
Map
Nearby Homes
- Lot 21 Cummings Cove Rd
- Lot 22 Cummings Cove Rd
- 11 Quimby Rd
- 39 Lake Country Rd
- 75 Neal Shore Rd
- 765 Scenic Rd
- 106 Needle Eye Rd
- 00 Nh Rte 132 Route
- 45 Stern Castle Place Unit 32
- 37
- 38 Stern Castle Place Unit 30
- Lot 12-3 Needle Eye Rd
- Lot 12-5 Needle Eye Rd
- 598 Scenic Rd Unit 2
- 598 Scenic Rd Unit 1
- 99 Pleasant St
- 97 Soleil Mountain Unit 82
- 94 Soleil Mountain Unit 8
- 6 Windjammer's Ridge
- 23 Deadreckoning Point
- 41 Old Hubbard Rd
- 39 Old Hubbard Rd
- 28 Wotanda Ln
- 26 Wotanda Ln
- 43 Old Hubbard Rd
- 30 Wotanda Ln
- 37 Old Hubbard Rd
- 24 Wotanda Ln
- 0 Old Hubbard Rd
- 160 Cummings Cove Rd
- 32 Wotanda Ln
- 27 Wotanda Ln
- 22 Wotanda Ln
- 148 Cummings Cove Rd
- 23 Wotanda Ln
- 144 Cummings Cove Rd
- 31 Wotanda Ln
- 152 Cummings Cove Rd
- 21 Wotanda Ln
- 20 Wotanda Ln