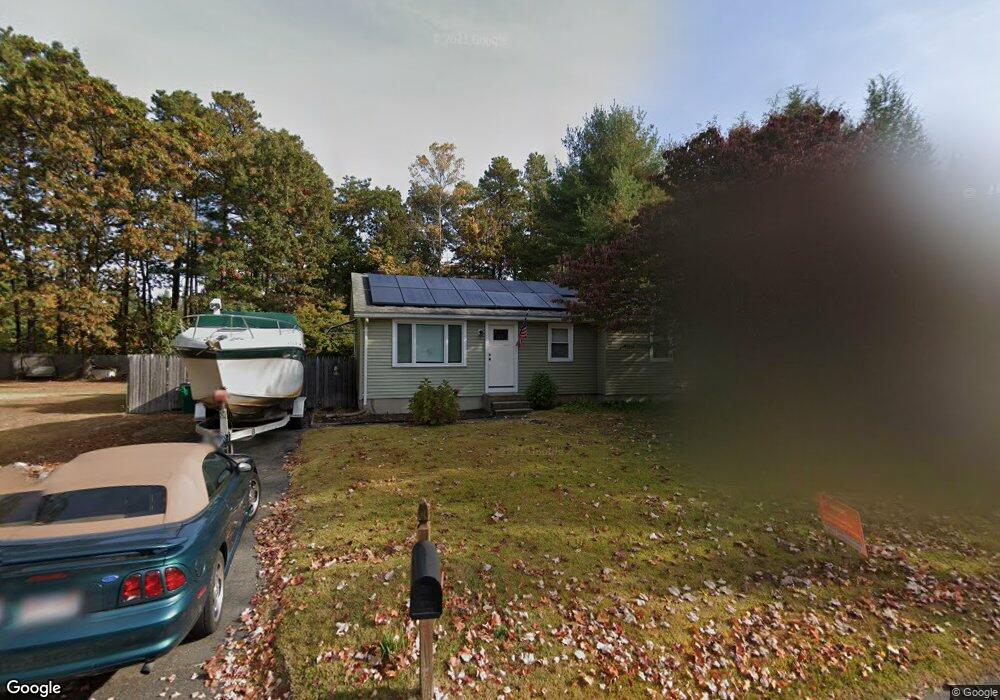
41 Phelps St Easthampton, MA 01027
Estimated Value: $334,000 - $358,000
3
Beds
2
Baths
936
Sq Ft
$371/Sq Ft
Est. Value
About This Home
This home is located at 41 Phelps St, Easthampton, MA 01027 and is currently estimated at $346,856, approximately $370 per square foot. 41 Phelps St is a home located in Hampshire County with nearby schools including Easthampton High School, Hilltown Cooperative Charter Public School, and Calvary Baptist Christian School.
Ownership History
Date
Name
Owned For
Owner Type
Purchase Details
Closed on
Jul 27, 2005
Sold by
Golinski Ellen
Bought by
Delpozzo Holly and Belisle Nathan
Current Estimated Value
Home Financials for this Owner
Home Financials are based on the most recent Mortgage that was taken out on this home.
Original Mortgage
$143,920
Outstanding Balance
$74,220
Interest Rate
5.67%
Mortgage Type
Purchase Money Mortgage
Estimated Equity
$272,636
Create a Home Valuation Report for This Property
The Home Valuation Report is an in-depth analysis detailing your home's value as well as a comparison with similar homes in the area
Home Values in the Area
Average Home Value in this Area
Purchase History
| Date | Buyer | Sale Price | Title Company |
|---|---|---|---|
| Delpozzo Holly | $179,900 | -- |
Source: Public Records
Mortgage History
| Date | Status | Borrower | Loan Amount |
|---|---|---|---|
| Open | Delpozzo Holly | $143,920 |
Source: Public Records
Tax History Compared to Growth
Tax History
| Year | Tax Paid | Tax Assessment Tax Assessment Total Assessment is a certain percentage of the fair market value that is determined by local assessors to be the total taxable value of land and additions on the property. | Land | Improvement |
|---|---|---|---|---|
| 2025 | $3,996 | $292,300 | $118,300 | $174,000 |
| 2024 | $3,858 | $284,500 | $114,900 | $169,600 |
| 2023 | $2,962 | $202,200 | $90,400 | $111,800 |
| 2022 | $3,342 | $202,200 | $90,400 | $111,800 |
| 2021 | $3,643 | $207,700 | $90,400 | $117,300 |
| 2020 | $3,591 | $202,200 | $90,400 | $111,800 |
| 2019 | $3,022 | $195,500 | $90,400 | $105,100 |
| 2018 | $2,906 | $181,600 | $85,400 | $96,200 |
| 2017 | $2,798 | $172,600 | $82,100 | $90,500 |
| 2016 | $2,878 | $184,600 | $82,100 | $102,500 |
| 2015 | $2,797 | $184,600 | $82,100 | $102,500 |
Source: Public Records
Map
Nearby Homes