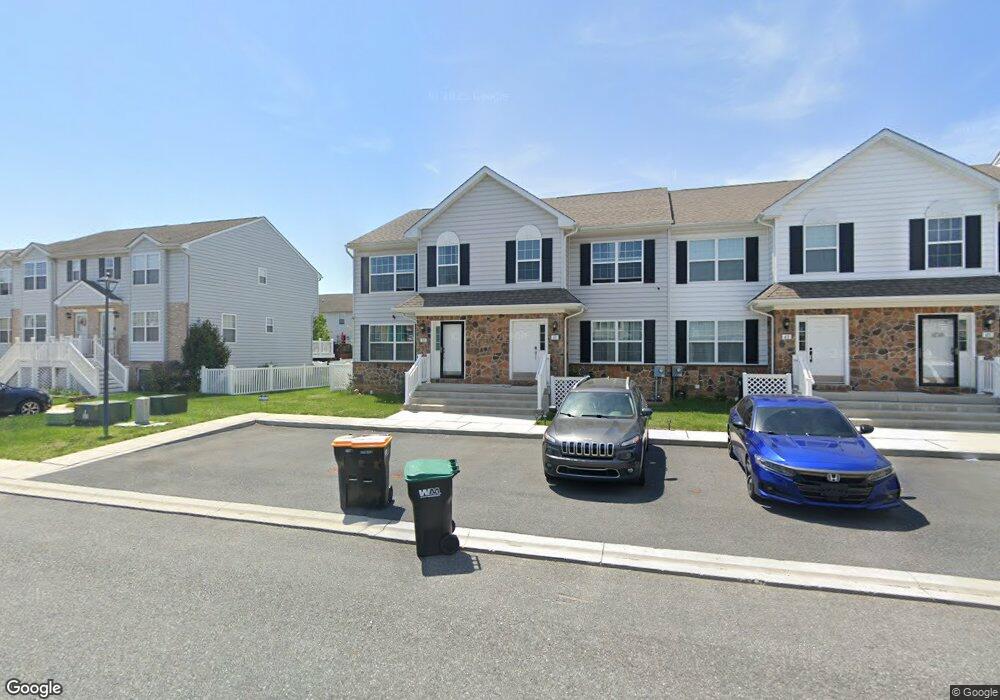
41 Renza Ln Smyrna, DE 19977
Estimated Value: $300,000 - $314,000
3
Beds
3
Baths
1,450
Sq Ft
$212/Sq Ft
Est. Value
About This Home
This home is located at 41 Renza Ln, Smyrna, DE 19977 and is currently estimated at $306,981, approximately $211 per square foot. 41 Renza Ln is a home with nearby schools including Smyrna Elementary School, John Bassett Moore Intermediate School, and Smyrna Middle School.
Ownership History
Date
Name
Owned For
Owner Type
Purchase Details
Closed on
Apr 14, 2021
Sold by
Lenape Development Inc
Bought by
Hammonds Shaquan Tinisha
Current Estimated Value
Home Financials for this Owner
Home Financials are based on the most recent Mortgage that was taken out on this home.
Original Mortgage
$208,817
Outstanding Balance
$188,281
Interest Rate
3.05%
Mortgage Type
FHA
Estimated Equity
$118,700
Create a Home Valuation Report for This Property
The Home Valuation Report is an in-depth analysis detailing your home's value as well as a comparison with similar homes in the area
Home Values in the Area
Average Home Value in this Area
Purchase History
| Date | Buyer | Sale Price | Title Company |
|---|---|---|---|
| Hammonds Shaquan Tinisha | $212,670 | None Available | |
| Lenape Development Inc | -- | None Listed On Document |
Source: Public Records
Mortgage History
| Date | Status | Borrower | Loan Amount |
|---|---|---|---|
| Open | Hammonds Shaquan Tinisha | $208,817 |
Source: Public Records
Tax History Compared to Growth
Tax History
| Year | Tax Paid | Tax Assessment Tax Assessment Total Assessment is a certain percentage of the fair market value that is determined by local assessors to be the total taxable value of land and additions on the property. | Land | Improvement |
|---|---|---|---|---|
| 2025 | $1,243 | $294,500 | $45,100 | $249,400 |
| 2024 | $1,243 | $294,500 | $45,100 | $249,400 |
| 2023 | $893 | $33,600 | $2,900 | $30,700 |
| 2022 | $851 | $33,600 | $2,900 | $30,700 |
| 2021 | $834 | $33,600 | $2,900 | $30,700 |
| 2020 | $7 | $300 | $300 | $0 |
| 2019 | $7 | $300 | $300 | $0 |
| 2018 | $7 | $300 | $300 | $0 |
| 2017 | $7 | $300 | $0 | $0 |
| 2016 | $7 | $300 | $0 | $0 |
| 2015 | $7 | $300 | $0 | $0 |
| 2014 | $6 | $300 | $0 | $0 |
Source: Public Records
Map
Nearby Homes