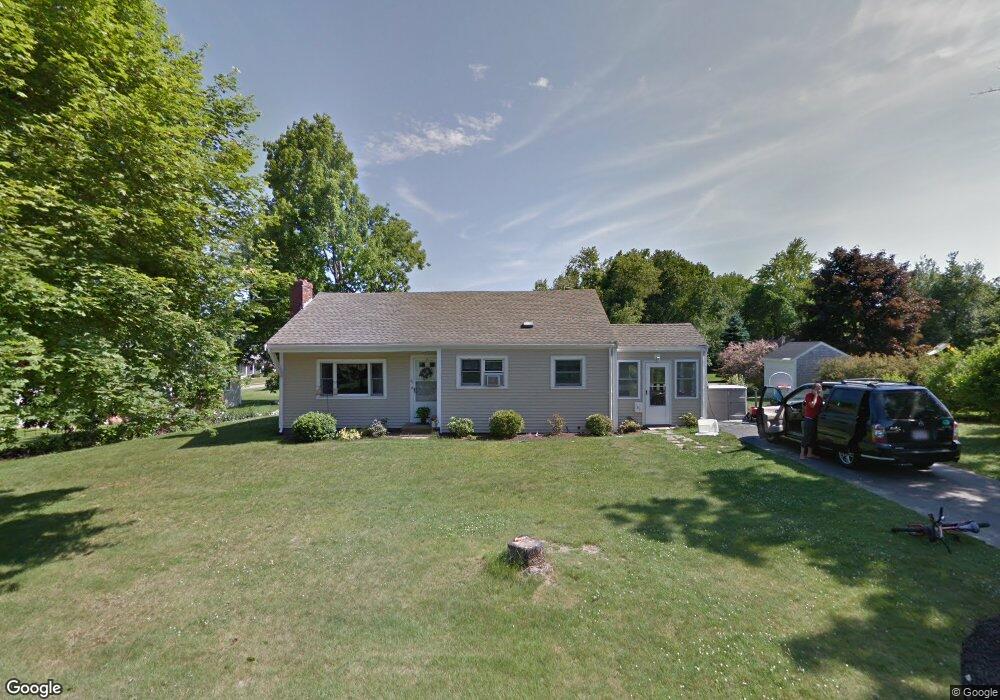
41 Russell Rd Whitman, MA 02382
Estimated Value: $533,383 - $582,000
3
Beds
2
Baths
1,490
Sq Ft
$369/Sq Ft
Est. Value
About This Home
This home is located at 41 Russell Rd, Whitman, MA 02382 and is currently estimated at $550,346, approximately $369 per square foot. 41 Russell Rd is a home located in Plymouth County with nearby schools including St Bridget School.
Ownership History
Date
Name
Owned For
Owner Type
Purchase Details
Closed on
Nov 13, 2019
Sold by
41 Russell Road Rt
Bought by
Heywood Peter C and Heywood Karen K
Current Estimated Value
Home Financials for this Owner
Home Financials are based on the most recent Mortgage that was taken out on this home.
Original Mortgage
$254,000
Outstanding Balance
$194,096
Interest Rate
3.6%
Mortgage Type
New Conventional
Estimated Equity
$356,250
Purchase Details
Closed on
Aug 19, 2010
Sold by
Heywood Peter C and Heywood Karen K
Bought by
41 Russell Road Rt and Heywood
Purchase Details
Closed on
May 30, 2006
Sold by
Carey George H and Collins Patricia A
Bought by
Heywood Peter C and Heywood Karen K
Home Financials for this Owner
Home Financials are based on the most recent Mortgage that was taken out on this home.
Original Mortgage
$304,000
Interest Rate
6.53%
Mortgage Type
Purchase Money Mortgage
Create a Home Valuation Report for This Property
The Home Valuation Report is an in-depth analysis detailing your home's value as well as a comparison with similar homes in the area
Home Values in the Area
Average Home Value in this Area
Purchase History
| Date | Buyer | Sale Price | Title Company |
|---|---|---|---|
| Heywood Peter C | -- | -- | |
| 41 Russell Road Rt | -- | -- | |
| 41 Russell Road Rt | -- | -- | |
| Heywood Peter C | $320,000 | -- |
Source: Public Records
Mortgage History
| Date | Status | Borrower | Loan Amount |
|---|---|---|---|
| Open | Heywood Peter C | $254,000 | |
| Previous Owner | Heywood Peter C | $296,817 | |
| Previous Owner | Heywood Peter C | $304,000 |
Source: Public Records
Tax History
| Year | Tax Paid | Tax Assessment Tax Assessment Total Assessment is a certain percentage of the fair market value that is determined by local assessors to be the total taxable value of land and additions on the property. | Land | Improvement |
|---|---|---|---|---|
| 2025 | $6,311 | $481,000 | $214,900 | $266,100 |
| 2024 | $5,621 | $441,200 | $210,700 | $230,500 |
| 2023 | $5,184 | $382,000 | $182,700 | $199,300 |
| 2022 | $5,105 | $350,600 | $166,100 | $184,500 |
| 2021 | $5,225 | $337,100 | $152,600 | $184,500 |
| 2020 | $5,227 | $329,800 | $145,300 | $184,500 |
| 2019 | $4,869 | $316,600 | $145,300 | $171,300 |
| 2018 | $4,619 | $288,500 | $137,000 | $151,500 |
| 2017 | $4,351 | $288,500 | $137,000 | $151,500 |
| 2016 | $4,234 | $271,600 | $129,800 | $141,800 |
| 2015 | $3,904 | $250,100 | $114,200 | $135,900 |
Source: Public Records
Map
Nearby Homes
Your Personal Tour Guide
Ask me questions while you tour the home.