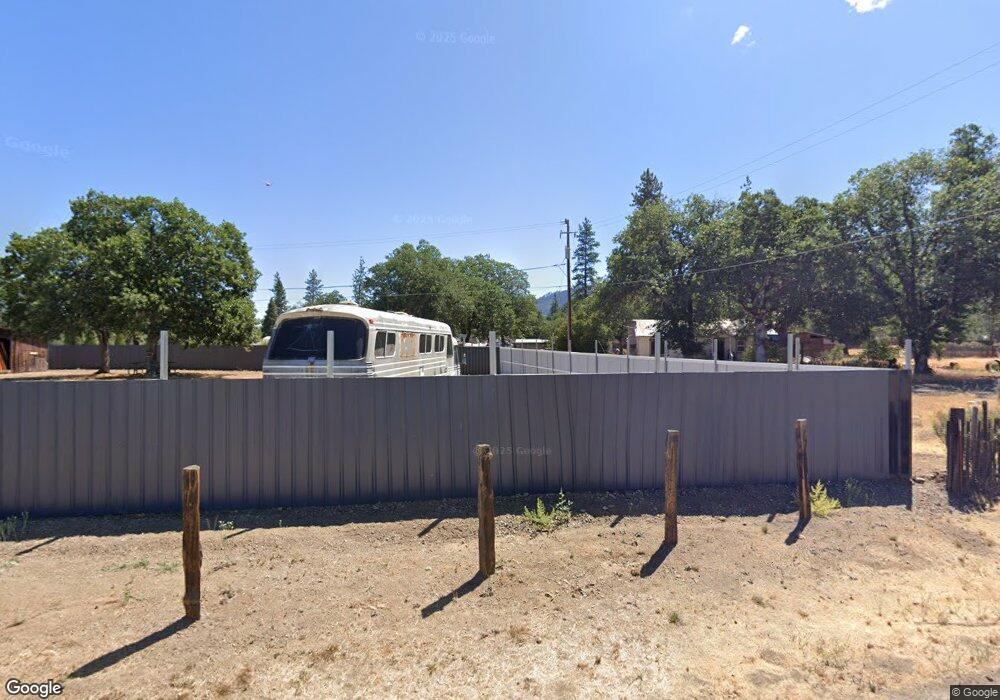
41 Trunnel Dr Hayfork, CA 96041
Estimated Value: $171,000 - $317,591
4
Beds
2
Baths
1,500
Sq Ft
$160/Sq Ft
Est. Value
About This Home
This home is located at 41 Trunnel Dr, Hayfork, CA 96041 and is currently estimated at $240,197, approximately $160 per square foot. 41 Trunnel Dr is a home with nearby schools including Hayfork High School.
Ownership History
Date
Name
Owned For
Owner Type
Purchase Details
Closed on
Feb 9, 2017
Sold by
Trunnell Uchytil Sandra A
Bought by
Baker Brenda L
Current Estimated Value
Home Financials for this Owner
Home Financials are based on the most recent Mortgage that was taken out on this home.
Original Mortgage
$191,468
Outstanding Balance
$159,057
Interest Rate
4.32%
Mortgage Type
FHA
Estimated Equity
$81,140
Create a Home Valuation Report for This Property
The Home Valuation Report is an in-depth analysis detailing your home's value as well as a comparison with similar homes in the area
Home Values in the Area
Average Home Value in this Area
Purchase History
| Date | Buyer | Sale Price | Title Company |
|---|---|---|---|
| Baker Brenda L | $195,000 | First American Title Company |
Source: Public Records
Mortgage History
| Date | Status | Borrower | Loan Amount |
|---|---|---|---|
| Open | Baker Brenda L | $191,468 |
Source: Public Records
Tax History
| Year | Tax Paid | Tax Assessment Tax Assessment Total Assessment is a certain percentage of the fair market value that is determined by local assessors to be the total taxable value of land and additions on the property. | Land | Improvement |
|---|---|---|---|---|
| 2025 | $2,512 | $226,309 | $63,829 | $162,480 |
| 2024 | $2,475 | $221,873 | $62,578 | $159,295 |
| 2023 | $2,475 | $217,523 | $61,351 | $156,172 |
| 2022 | $2,428 | $213,259 | $60,149 | $153,110 |
| 2021 | $2,247 | $209,078 | $58,970 | $150,108 |
| 2020 | $2,199 | $206,935 | $58,366 | $148,569 |
| 2019 | $2,156 | $202,878 | $57,222 | $145,656 |
| 2018 | $2,098 | $198,900 | $56,100 | $142,800 |
| 2017 | $863 | $71,543 | $5,633 | $65,910 |
| 2016 | $763 | $70,141 | $5,523 | $64,618 |
| 2015 | $753 | $69,089 | $5,441 | $63,648 |
| 2014 | $743 | $67,737 | $5,335 | $62,402 |
Source: Public Records
Map
Nearby Homes
- 305 Pine Ave
- 355 Pine Ave
- 1240 Morgan Hill Rd
- 134 W Humboldt St
- 820 Kingsbury Rd
- 134 Humboldt St
- 7020 California 3
- 63 Michel St
- 7021 California 3
- 70 Oak Ave
- 71 Tule Creek Rd
- 310 Reservoir Rd
- 20 Genest St
- 675 Hyampom
- 355 Oliva Dr
- 125 Cedar Gulch Rd
- 347 Buck Ln
- 341 Buck Ln
- 1095 Hyampom Rd
- 480 Oliva Dr
Your Personal Tour Guide
Ask me questions while you tour the home.